
Linking Leaf N:P Stoichiometry to Species Richness and Composition along a Slope Aspect Gradient in the Eastern Tibetan Meadows


1
Division of Grassland Science, College of Animal Science and Technology, Yangzhou University, Yangzhou 225009, China
2
Department of Life Science, Lanzhou University, Lanzhou 730000, China
*
Author to whom correspondence should be addressed.
Diversity 2022, 14(4), 245; https://doi.org/10.3390/d14040245
Submission received: 5 March 2022
/
Revised: 25 March 2022
/
Accepted: 26 March 2022
/
Published: 27 March 2022
(This article belongs to the Special Issue Mountain Biodiversity, Ecosystem Functioning and Services)
Abstract
:As an important topographical factor, slope aspect has an essential influence on plant community structure and leaf traits. Leaf nitrogen (N) and phosphorus (P) stoichiometry is an important leaf trait indicating plant growth. However, it has rarely been studied how leaf N:P stoichiometry correlates with plant community structure along the slope aspect gradient. To understand the variation of leaf N:P stoichiometry and community structure, as well as their correlation with each other, the species composition and leaf N and P in Tibetan meadows were investigated across three slope aspects: the south-, west-, and north-facing slope aspects (i.e., SFS, WFS, and NFS). In our results, leaf N:P ratio was significantly lower on the NFS than on the SFS, indicating N and P limitation on the NFS and SFS, respectively. Richness of forb species and all species was higher on the NFS than on the SFS and was negatively correlated with leaf N concentration, whereas graminoid richness was not statistically different among the slope aspects and showed a negative correlation with leaf P concentration. Thus, our results provide evidence for the functional significance of leaf N:P stoichiometry for species composition along a natural environmental gradient. Our findings could provide applicable guidance in the refinement of grassland management and biodiversity conservation based on topography.
1. Introduction
Leaf nitrogen (N) and phosphorus (P) are the two most limiting elements of terrestrial vegetation relating to plant growth, development, and reproduction [1,2,3] because N is the key component of proteins that play pivotal roles in plant photosynthesis as enzymes, whereas P is critical to the formation of NADPH, ATP, and ribosomal RNA in the process of protein synthesis [4,5]. Furthermore, the critical leaf N:P ratio has been widely used to diagnose the type of nutrient limitations to plant productivity [6,7,8]. Leaf N and P concentration and allocation have been found to vary along environment gradients; although numerous studies have focused on their latitudinal and altitudinal patterns [9,10,11,12,13,14,15,16], it has rarely been studied how they change along the slope aspect gradient. Investigations on leaf N:P stoichiometry across slope aspects can provide applicable guidance in the refinement of grassland management and conservation based on topography at the local scale.
Leaf N and P availability also shows important functional significance for community composition [6]. In particular, relationships between plant N:P ratios and species richness are of particular interest in the context of biodiversity conservation and anthropogenic activities. Many studies have found the N:P ratio to be correlated with the richness and composition of species [17,18,19]. The coexistence of species was suggested to be possibly facilitated by P limitation, since the competition for P with lower mobility is weaker than the competition for resources of high mobility in soil [17,20] and is facilitated by colimitation because differential nutrient limitations may reduce interspecific competition [21,22] but could also be weakened by the P limitation possibly resulting from P deficiency or nutrient imbalance [6] or the disproportionate increase in dominant clonal graminoids [23]. Hence, different correlations of species richness with plant N and P stoichiometry have been reported [17,18,24,25,26]. Moreover, a high leaf N:P ratio was expected to be associated with more graminoids and fewer forbs in vegetation [23]. However, most of these studies were indirectly demonstrated in experiments with nitrogen fertilization or deposition, and direct evidence is rare along natural environmental gradients. The slope aspect gradient significantly contributed to the heterogeneity of vegetation in mountain areas and thus provided an ideal platform to explore the relationships between leaf N/P stoichiometry and community structure.
Typically, south-facing slopes in the northern hemisphere (i.e., equator-facing slopes) are hot and dry, as the equator-facing orientation is associated with the strongest solar irradiation, whereas north-facing slopes (i.e., polar-facing slopes) are wet and cold, resulting from the lowest solar irradiations; western- or eastern-facing slopes are intermediate in terms of these aspects. Slope aspect substantially contributes to the heterogeneity of vegetation [27,28,29,30,31,32], possibly owing to the substantial microenvironmental changes, such as solar irradiance, soil moisture and temperature, and soil nutrients [33,34,35,36]. However, it is still not clear how vegetation heterogeneity, including species richness and composition, is associated with leaf N:P stoichiometry. Therefore, in the current study, based on a slope aspect gradient in the Tibetan meadow, we mainly aimed to explore the following questions: (1) How do leaf [N] and [P] and the N:P ratio vary in different slope aspects? (2) How do species richness and composition change with slope aspect? (3) How does leaf N:P stoichiometry correlate with species richness and composition along the slope aspect gradient?
2. Materials and Methods
2.1. Study Sites
Our study was conducted in an alpine meadow in the eastern part of the Tibetan Plateau in China. The Research Station of Alpine Meadow and Wetland Ecosystems of Lanzhou University has locations at two elevations: 2960 m and 3650 m (Figure 1A). Data were collected at these two sites: Hezuo (34°44′ N,102°53′ E) and Maqu (33°39′ N,101°53′ E), with the vegetation landscape shown in Figure 1B. We also recorded the precipitation and temperature of these two sites during the period of 1981–2017 according to geographical coordinates using the climate dataset provided by National Tibetan Plateau Data Center (http://data.tpdc.ac.cn (accessed on 10 May 2021)). The mean annual precipitation in Hezuo and Maqu was 570 mm and 690 mm, and the mean annual temperature was around 4 °C and 2 °C, respectively. The monthly mean precipitation and monthly mean, maximum, and minimum temperatures are shown in Figure 1C. Details about the study site can also be found in our previous publications [36,37].
2.2. Leaf N and P Concentration Measurements
In August of 2008, during the peak growing season, a 5 m × 5 m plot was established on each of the south-, west-, and north-facing slopes (i.e., SFS, WFS, and NFS) based on the shape of the hill and the ability to collect leaf samples at each site. At each plot, mature and healthy leaf samples were collected from 3–5 individuals of the dominant species. Across the six plots, 80 observations were collected in total, with 41 observations of 25 species in Hezuo and 39 observations of 20 species in Maqu. The measured species in each site, with their average leaf N and P content per unit of mass (hereafter leaf [N] and [P]), are shown in Table 1. All the species were simply classified into three plant functional groups (PFGs): graminoids (Poaceae and Cyperaceae), non-legume forbs (forbs), and legumes. However, in two plots, dwarf shrub was also found on the NFS.
After drying for 48 h at 70 °C, we ground the dry leaves to powder using a mortar. A total of 0.2 g of leaf powder was digested with H2SO4-H2O2. Digested solution was used to determine leaf [N] with a VAPODEST 40 programmable distillation system (Gerhardt, Germany), and leaf [P] by the vanadium-ammonium molybdate colorimetric method [38].
2.3. Species Composition Measurement
In each plot, we placed three 50 cm × 50 cm quadrates as replicates to survey the species by recording their names, coverage (%), and richness (i.e., the number of species) and then classified all the species into the four plant functional groups: graminoids, forbs, legumes, and shrubs (if any). The coverage was estimated visually, but significantly positive correlation of coverage and species richness confirmed the data reliability (R2 = 0.418, p < 0.001).
2.4. Data Analysis
Firstly, the effects of slope aspect on leaf [N], [P], and N:P ratio were detected using a linear mixed model by treating “site” as the random factor (LMM) for the mixed samples, with species-level value as a replicate unit and one common species, Anaphalis lacteal, that occurred in each of the six plots. Correlations among leaf [N], [P], and N:P ratio were evaluated in each site using linear models. Comparison of the leaf N:P stoichiometry between different PFGs was also conducted using the LMM. Secondly, the effects of slope aspect on species richness and coverage and their correlations with leaf N:P stoichiometry (using plot-level means) were analyzed using LMM.
All the variables were log10-transformed. All analyses were performed with R version 4.0.3 (R Core Team, 2020) in RStudio version 1.3.1093 (RStudio Team, 2020).
3. Results
3.1. Variations in Leaf [N], [P], and N:P Ratio across the Slope Aspects
The leaf [N], [P], and N:P ratios ranged from 10.09 to 42.96, 0.89 to 3.10, and 8.10 to 23.63 mg g−1 in Hezuo and from 4.36 to 33.53, 0.536 to 2.33, and 4.14 to 21.21 mg g−1 in Maqu, respectively. Overall, the leaf [N], [P], and N:P ratios were all significantly lower in Maqu, with higher elevations than in Hezuo (Figure 2A,C,E).
Although leaf [N] and [P] were not significantly different between slope aspects, leaf N:P ratio was significantly lower on the NFS than on the SFS for the mixed samples (Figure 2). The one common species, Anaphalis lacteal, showed the same patterns as those of the mixed samples (Figure S1). Moreover, significant correlations between leaf [N] and [P] and between the leaf N:P ratio and leaf [N] rather than [P] were found in each plot (Figure 3). In addition, legumes showed a significantly higher leaf [N] and [P] than forbs and graminoids and a higher leaf N:P ratio than forbs (Figure S2).
3.2. Correlations of Leaf Traits with Species Richness and Coverage
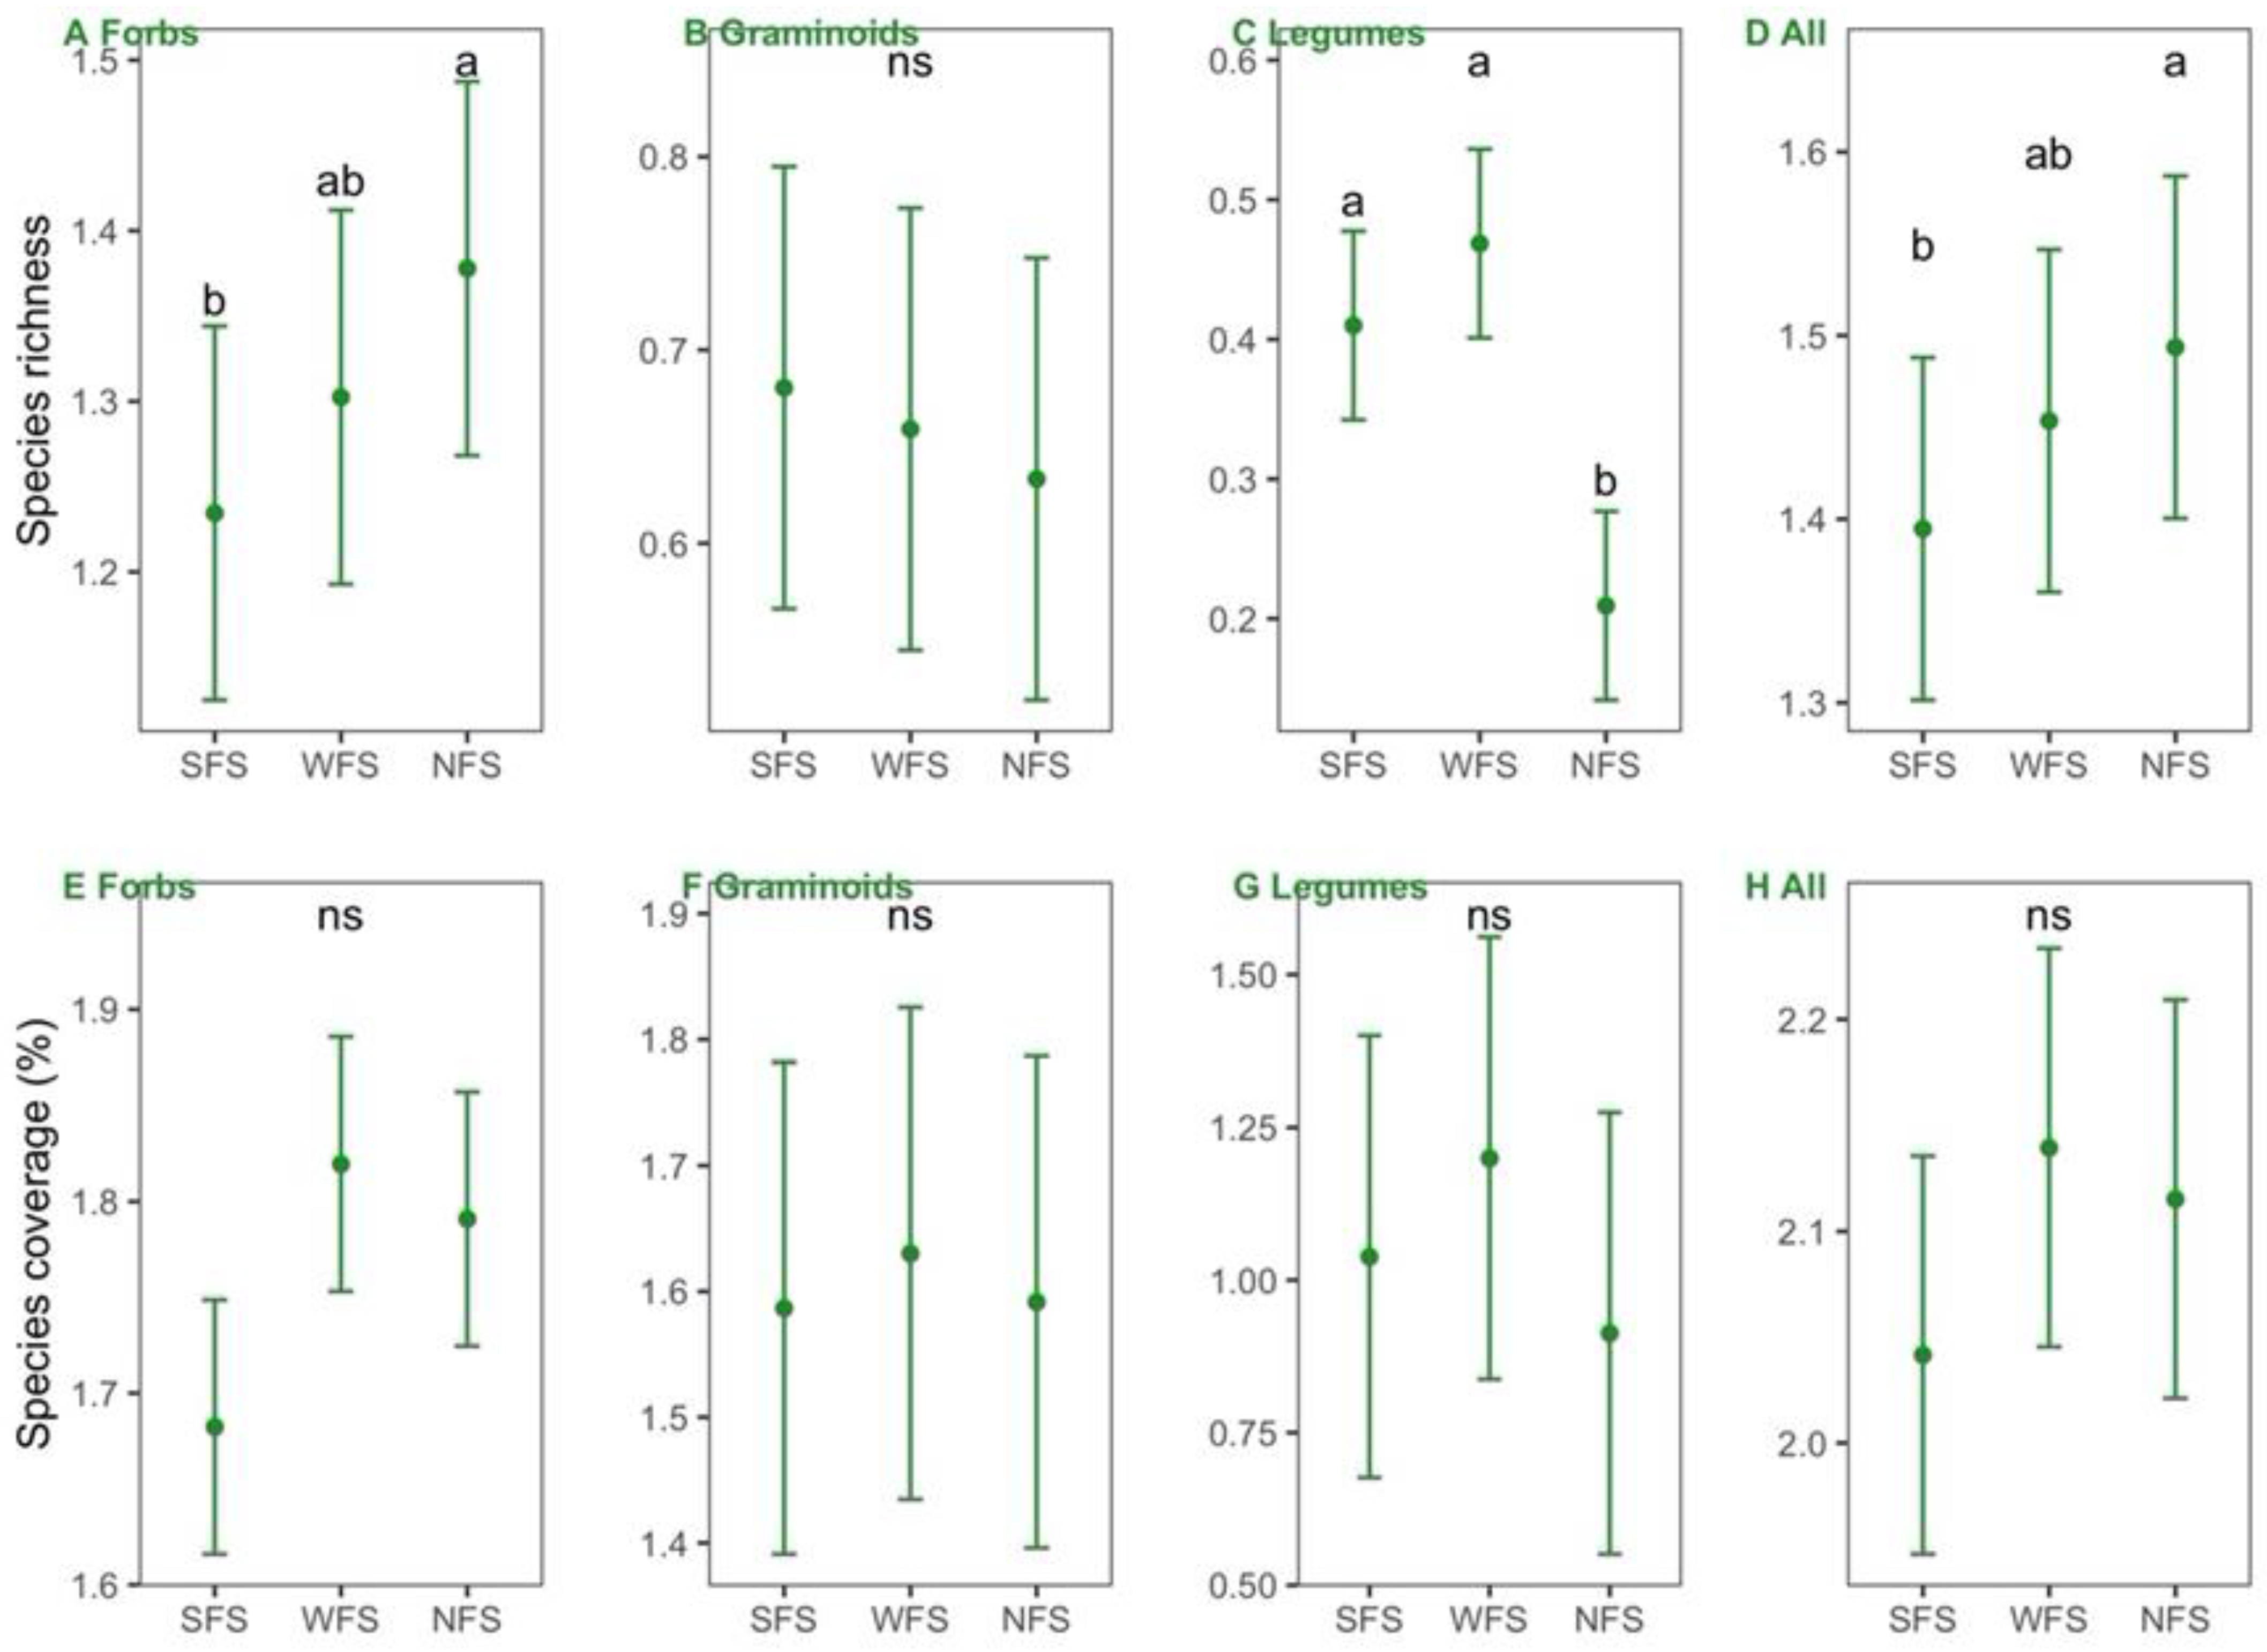
Significantly higher richness of all species and forbs and lower richness of legumes were found on the NFS than on the SFS and WFS (Figure 4A–D); however, the richness of graminoids and plant coverage for each PFG and for all species did not differ significantly among the slope aspects (Figure 4E–H).
The correlations were found to be significantly negative between leaf [N] and richness of all species (R2 = 0.615, p = 0.047) and forb species (R2 = 0.570, p = 0.061), between leaf [P] and graminoid richness (R2 = 0.362, p = 0.093), and between leaf N:P ratios and forb richness (R2 = 0.675, p = 0.032) (Figure 5). On the other hand, legume coverage was positively correlated with leaf [N] (R2 = 0.809, p = 0.010), and the coverage of graminoids and all species was negatively and positively correlated with leaf [P] and with marginal significance and significance, respectively (R2 = 0.051 and 0.704, p = 0.103 and 0.029, respectively) (Figure 6).
4. Discussion
4.1. Variations in Leaf [N], [P], and N:P Ratio across Different Slope Aspects
Although leaf [N] and [P] did not differ significantly between slope aspects, we found a significantly lower N:P ratio on the NFS, with a mean of 11, and a higher N:P ratio on the SFS, with a mean of 16, which was consistent with a previous study reporting that the lowest N:P ratio occurred on the NFS out of the four slope aspects [39]. Tessier and Raynal [8] pointed out that plants were subject to N-, P-, and co-limitation when the plant N:P ratio was less than 14, higher than 16, and between 14 and 16, respectively. Therefore, our results indicate that plants on the NFS suffered N limitation. The tight correlation of leaf [N] with N:P ratio suggests that leaf N:P is determined by leaf [N] along the slope aspect gradient. A lower soil N availability reported in our previous studies [36] was probably the reason for the lower leaf N:P ratio on the NFS, which supports the biogeochemical hypothesis suggesting that plant N and P are influenced by the availability of soil nutrients [9]. The lower soil N on the NFS was perhaps due to lower temperatures reducing the decomposition and mineralization of organic material.
4.2. Correlations of Leaf N:P Stoichiometry with Species Richness and Coverage across the Slope Aspects
Significantly higher species richness in each quadrate was found on the NFS than on the SFS, which was mainly caused by the variation in forb richness. These results are consistent with previous studies in which species richness was significantly lower on the SFS [31,41], with the possible mechanism of lower soil water content as the limiting factor.
Community species richness was negatively correlated with leaf [N], which is consistent with the negative effects of N-fertilization on species diversity [42,43,44,45]. Many N-fertilization experiments showed considerable species loss, with the underlying improved growth of dominating clonal graminoids excluding forbs through competition [45,46]. The possible mechanisms may be that N-fertilization led to a tendency of P limitation, but graminids are often considered stress-tolerant species due to their low requirement for P and K [47]. Therefore, we found negative correlations of leaf [P] with graminoid richness and coverage because higher leaf [P] indicated the rapid growth of P-sensitive species. The significant negative correlations between leaf N:P ratio and forb richness provide direct evidence that on the natural environmental gradient, a higher N:P ratio is associated with fewer forbs and more graminoids, as hypothesized by Güsewell [6].
In addition, the higher legume richness on the SFS and the positive correlation of legume coverage with leaf [N] were consistent with the higher N:P ratio on the SFS due to their N-fixing functions.
5. Conclusions
In this study, we linked species composition and leaf N:P stoichiometry along a slope aspect gradient. Our results reveal different types of nutrition limitation and species compositions in different slope aspects and highlight the functional significance of leaf N:P stoichiometry in community composition along a slope aspect gradient. We found that leaf N:P ratio was significantly lower on the NFS than on the SFS and WFS, although leaf [N] and [P] were not statistically different between slope aspects, implying N limitation and P limitation of plant growth on the NFS and SFS, respectively. Higher richness and coverage of forbs were found on the NFS than on the SFS, whereas those that of graminoids did not differ significantly between slope aspects. The variations in forb and graminoid richness were largely explained by leaf [N] and [P], respectively, with the possible mechanism of different N or P requirements for different PFGs. However, the mechanisms underlying the variations in leaf N:P stoichiometry and community composition across slope aspects are still not clear because we did not explore their correlations with environmental or soil factors.
Supplementary Materials
The following are available online at https://www.mdpi.com/article/10.3390/d14040245/s1, Figure S1: Comparisons of leaf [N] (A,B), [P] (C,D), and N:P ratio (E,F) between sites and among slope aspects, respectively, for the species Anaphalis lacteal, Figure S2: Comparisons of leaf [N] (Panel A), [P] (Panel B), and N:P ratio (Panel C) between different plant functional groups (PFGs).
Author Contributions
Conceptualization, X.L.; methodology, R.Z.; software, X.L.; formal analysis, X.L.; investigation, X.L.; data curation, Y.H., X.Z. and C.Q.; writing—original draft preparation, X.L.; writing—review and editing, Y.H.; visualization, X.L.; supervision, X.L.; project administration, X.L. and R.Z.; funding acquisition, X.L. All authors have read and agreed to the published version of the manuscript.
Funding
This study was supported by the funding from Yangzhou University.
Data Availability Statement
The data presented in this study are available in article and Supplementary Materials.
Acknowledgments
We thank Zhao Jun, Song Xiaoyu, Nie Yingying, Chen Lingyun, and Zhang Jieqi for their help in the field and lab experiments. We thank Cui Xia for her help in working on Figure 1. This work was supported by the Research Station of Alpine Meadow and Wetland Ecosystems (RSAMWE) of Lanzhou University.
Conflicts of Interest
The authors declare no conflict of interest.
References
- Vitousek, P.M.; Porder, S.; Houlton, B.Z.; Chadwick, O.A. Terrestrial phosphorus limitation: Mechanisms, implications, and nitrogen–phosphorus interactions. Ecol. Appl. 2010, 20, 5–15. [Google Scholar] [CrossRef] [PubMed] [Green Version]
- LeBauer, D.S.; Treseder, K.K. Nitrogen limitation of net primary productivity in terrestrial ecosystems is globally distributed. Ecology 2008, 89, 371–379. [Google Scholar] [CrossRef] [PubMed] [Green Version]
- Du, E.; Terrer, C.; Pellegrini, A.F.; Ahlström, A.; van Lissa, C.J.; Zhao, X.; Xia, N.; Wu, X.; Jackson, R.B. Global patterns of terrestrial nitrogen and phosphorus limitation. Nat. Geosci. 2020, 13, 221–226. [Google Scholar] [CrossRef]
- Elser, J.; Sterner, R.; Gorokhova, E.a.; Fagan, W.; Markow, T.; Cotner, J.; Harrison, J.; Hobbie, S.; Odell, G.; Weider, L. Biological stoichiometry from genes to ecosystems. Ecol. Lett. 2000, 3, 540–550. [Google Scholar] [CrossRef] [Green Version]
- Taiz, L.; Zeiger, E. Photosynthesis: Physiological and ecological considerations. Plant Physiol 2002, 9, 172–174. [Google Scholar]
- Güsewell, S. N:P ratios in terrestrial plants: Variation and functional significance. New Phytol. 2004, 164, 243–266. [Google Scholar] [CrossRef]
- Schade, J.D.; Espeleta, J.F.; Klausmeier, C.A.; McGroddy, M.E.; Thomas, S.A.; Zhang, L. A conceptual framework for ecosystem stoichiometry: Balancing resource supply and demand. Oikos 2005, 109, 40–51. [Google Scholar] [CrossRef]
- Tessier, J.T.; Raynal, D.J. Use of nitrogen to Phosphorus ratios in plant tissue as an indicator of nutrient limitation and nitrogen saturation. J. Appl. Ecol. 2003, 40, 523–534. [Google Scholar] [CrossRef]
- Reich, P.B.; Oleksyn, J. Global patterns of plant leaf N and P in relation to temperature and latitude. Proc. Natl. Acad. Sci. USA 2004, 101, 11001–11006. [Google Scholar] [CrossRef] [Green Version]
- Han, W.; Fang, J.; Guo, D.; Zhang, Y. Leaf nitrogen and phosphorus stoichiometry across 753 terrestrial plant species in China. New Phytol. 2005, 168, 377–385. [Google Scholar] [CrossRef]
- Chen, Y.; Han, W.; Tang, L.; Tang, Z.; Fang, J. Leaf nitrogen and phosphorus concentrations of woody plants differ in responses to climate, soil and plant growth form. Ecography 2013, 36, 178–184. [Google Scholar] [CrossRef]
- He, J.-S.; Wang, L.; Flynn, D.F.; Wang, X.; Ma, W.; Fang, J. Leaf nitrogen: Phosphorus stoichiometry across Chinese grassland biomes. Oecologia 2008, 155, 301–310. [Google Scholar] [CrossRef] [PubMed]
- Zhang, L.; Wang, L.; He, W.; Zhang, X.; An, L.; Xu, S. Patterns of Leaf N:P Stoichiometry along Climatic Gradients in Sandy Region, North of China. J. Plant Ecol. 2016, 11, 218–225. [Google Scholar] [CrossRef] [Green Version]
- Kang, H.; Zhuang, H.; Wu, L.; Liu, Q.; Shen, G.; Berg, B.; Man, R.; Liu, C. Variation in leaf nitrogen and phosphorus stoichiometry in Picea abies across Europe: An analysis based on local observations. For. Ecol. Manag. 2011, 261, 195–202. [Google Scholar] [CrossRef]
- Waigwa, A.N.; Mwangi, B.N.; Wahiti, G.R.; Omengo, F.; Zhou, Y.; Wang, Q.; Schmid, B. Variation of morphological and leaf stoichiometric traits of two endemic species along the elevation gradient of Mount Kenya, East Africa. J. Plant Ecol. 2020, 13, 785–792. [Google Scholar] [CrossRef]
- Zhao, N.; Yu, G.; He, N.; Xia, F.; Wang, Q.; Wang, R.; Xu, Z.; Jia, Y. Invariant allometric scaling of nitrogen and phosphorus in leaves, stems, and fine roots of woody plants along an altitudinal gradient. J. Plant Res. 2016, 129, 647–657. [Google Scholar] [CrossRef] [PubMed] [Green Version]
- Güsewell, S.; Bailey, K.M.; Roem, W.J.; Bedford, B.L. Nutrient limitation and botanical diversity in wetlands: Can fertilisation raise species richness? Oikos 2005, 109, 71–80. [Google Scholar] [CrossRef]
- Blanck, Y.-L.; Gowda, J.; Mårtensson, L.-M.; Sandberg, J.; Fransson, A.-M. Plant species richness in a natural Argentinian matorral shrub-land correlates negatively with levels of plant phosphorus. Plant Soil 2011, 345, 11–21. [Google Scholar] [CrossRef]
- Sasaki, T.; Yoshihara, Y.; Jamsran, U.; Ohkuro, T. Ecological stoichiometry explains larger-scale facilitation processes by shrubs on species coexistence among understory plants. Ecol. Eng. 2010, 36, 1070–1075. [Google Scholar] [CrossRef]
- Huston, M.A.; DeAngelis, D.L. Competition and coexistence: The effects of resource transport and supply rates. Am. Nat. 1994, 144, 954–977. [Google Scholar] [CrossRef]
- Bracken, M.E.; Hillebrand, H.; Borer, E.T.; Seabloom, E.W.; Cebrian, J.; Cleland, E.E.; Elser, J.J.; Gruner, D.S.; Harpole, W.S.; Ngai, J.T. Signatures of nutrient limitation and co-limitation: Responses of autotroph internal nutrient concentrations to nitrogen and phosphorus additions. Oikos 2015, 124, 113–121. [Google Scholar] [CrossRef]
- Braakhekke, W.G.; Hooftman, D.A. The resource balance hypothesis of plant species diversity in grassland. J. Veg. Sci. 1999, 10, 187–200. [Google Scholar] [CrossRef]
- Theodose, T.A.; Roths, J.B. Variation in nutrient availability and plant species diversity across forb and graminoid zones of a Northern New England high salt marsh. Plant Ecol. 1999, 143, 219–228. [Google Scholar] [CrossRef]
- Pekin, B.K.; Boer, M.M.; Wittkuhn, R.S.; Macfarlane, C.; Grierson, P.F. Plant diversity is linked to nutrient limitation of dominant species in a world biodiversity hotspot. J. Veg. Sci. 2012, 23, 745–754. [Google Scholar] [CrossRef]
- Harpole, W.S.; Sullivan, L.L.; Lind, E.M.; Firn, J.; Adler, P.B.; Borer, E.T.; Chase, J.; Fay, P.A.; Hautier, Y.; Hillebrand, H. Addition of multiple limiting resources reduces grassland diversity. Nature 2016, 537, 93–96. [Google Scholar] [CrossRef] [PubMed]
- Olde Venterink, H. Does phosphorus limitation promote species-rich plant communities? Plant Soil 2011, 345, 1–9. [Google Scholar] [CrossRef] [Green Version]
- Armesto, J.J.; Martίnez, J.A. Relations between vegetation structure and slope aspect in the mediterranean region of Chile. J. Ecol. 1978, 881–889. [Google Scholar] [CrossRef]
- Bennie, J.; Hill, M.O.; Baxter, R.; Huntley, B. Influence of slope and aspect on long-term vegetation change in British chalk grasslands. J. Ecol. 2006, 94, 355–368. [Google Scholar] [CrossRef]
- Gallardo-Cruz, J.A.; Pérez-García, E.A.; Meave, J.A. β-Diversity and vegetation structure as influenced by slope aspect and altitude in a seasonally dry tropical landscape. Landsc. Ecol. 2009, 24, 473–482. [Google Scholar] [CrossRef]
- Kutiel, P. Slope aspect effect on soil and vegetation in a Mediterranean ecosystem. Isr. J. Plant Sci. 1992, 41, 243–250. [Google Scholar]
- Kutiel, P.; Lavee, H. Effect of slope aspect on soil and vegetation properties along an aridity transect. Isr. J. Plant Sci. 1999, 47, 169–178. [Google Scholar] [CrossRef]
- Yang, J.; El-Kassaby, Y.A.; Guan, W. The effect of slope aspect on vegetation attributes in a mountainous dry valley, Southwest China. Sci. Rep. 2020, 10, 16465. [Google Scholar] [CrossRef] [PubMed]
- Ng, E.; Miller, P.C. Soil moisture relations in the southern California chaparral. Ecology 1980, 61, 98–107. [Google Scholar] [CrossRef]
- Sidari, M.; Ronzello, G.; Vecchio, G.; Muscolo, A. Influence of slope aspects on soil chemical and biochemical properties in a Pinus laricio forest ecosystem of Aspromonte (Southern Italy). Eur. J. Soil Biol. 2008, 44, 364–372. [Google Scholar] [CrossRef]
- Singh, S. Understanding the role of slope aspect in shaping the vegetation attributes and soil properties in Montane ecosystems. Trop. Ecol. 2018, 59, 417–430. [Google Scholar]
- Li, X.; Nie, Y.; Song, X.; Zhang, R.; Wang, G. Patterns of species diversity and functional diversity along a south- to north-facing slope in a subalpine meadow. Community Ecol. 2011, 12, 179–187. [Google Scholar] [CrossRef]
- Li, X.; Song, X.; Zhao, J.; Lu, H.; Qian, C.; Zhao, X. Shifts and plasticity of plant leaf mass per area and leaf size among slope aspects in a subalpine meadow. Ecol. Evol. 2021, 11, 14042–14055. [Google Scholar] [CrossRef]
- Olsen, S.R. Estimation of Available Phosphorus in Soils by Extraction with Sodium Bicarbonate; US Department of Agriculture: Washington DC, USA, 1954.
- Qin, Y.; Feng, Q.; Adamowski, J.F.; Zhu, M.; Zhang, X. Community level response of leaf stoichiometry to slope aspect in a montane environment: A case study from the Central Qilian Mountains, China. Glob. Ecol. Conserv. 2021, 28, e01703. [Google Scholar] [CrossRef]
- Zhang, Y.; Li, C.; Wang, M. Linkages of C: N:P stoichiometry between soil and leaf and their response to climatic factors along altitudinal gradients. J. Soils Sediments 2019, 19, 1820–1829. [Google Scholar] [CrossRef]
- Nadal-Romero, E.; Petrlic, K.; Verachtert, E.; Bochet, E.; Poesen, J. Effects of slope angle and aspect on plant cover and species richness in a humid Mediterranean badland. Earth Surf. Processes Landf. 2014, 39, 1705–1716. [Google Scholar] [CrossRef]
- Zhao, Y.; Yang, B.; Li, M.; Xiao, R.; Rao, K.; Wang, J.; Zhang, T.; Guo, J. Community composition, structure and productivity in response to nitrogen and phosphorus additions in a temperate meadow. Sci. Total Environ. 2019, 654, 863–871. [Google Scholar] [CrossRef] [PubMed]
- Midolo, G.; Alkemade, R.; Schipper, A.M.; Benítez-López, A.; Perring, M.P.; De Vries, W. Impacts of nitrogen addition on plant species richness and abundance: A global meta-analysis. Glob. Ecol. Biogeogr. 2019, 28, 398–413. [Google Scholar] [CrossRef] [Green Version]
- Soons, M.B.; Hefting, M.M.; Dorland, E.; Lamers, L.P.; Versteeg, C.; Bobbink, R. Nitrogen effects on plant species richness in herbaceous communities are more widespread and stronger than those of phosphorus. Biol. Conserv. 2017, 212, 390–397. [Google Scholar] [CrossRef]
- De Schrijver, A.; De Frenne, P.; Ampoorter, E.; Van Nevel, L.; Demey, A.; Wuyts, K.; Verheyen, K. Cumulative nitrogen input drives species loss in terrestrial ecosystems. Glob. Ecol. Biogeogr. 2011, 20, 803–816. [Google Scholar] [CrossRef]
- Wilson, S.D.; Tilman, D. Quadratic variation in old-field species richness along gradients of disturbance and nitrogen. Ecology 2002, 83, 492–504. [Google Scholar] [CrossRef]
- De Kroon, H.; Bobbink, R. Clonal plant dominance under elevated nitrogen deposition, with special reference to Brachypodium pinnatum in chalk grassland. In The Ecology and Evolution of Clonal Plants; Backhuys Publishers: Leiden, The Netherlands, 1997; pp. 359–379. [Google Scholar]
Figure 1.
Site location in the Tibetan Plateau (Panel A), the vegetation landscape (Panel B), and key climate factors (Panel C) of the two study sites (Hezuo and Maqu). Tmean, Tmax, and Tmin represent the monthly mean, maximum, and minimum temperature, respectively.
Figure 1.
Site location in the Tibetan Plateau (Panel A), the vegetation landscape (Panel B), and key climate factors (Panel C) of the two study sites (Hezuo and Maqu). Tmean, Tmax, and Tmin represent the monthly mean, maximum, and minimum temperature, respectively.

Figure 2.
Comparisons of leaf [N] (A,B), [P] (C,D), and N:P ratio (E,F) between sites and among slope aspects. SFS, WFS, and NFS represent south-, west-, and north-facing slope aspects, respectively. Different letters represent significant differences at the level of p < 0.05. Variables are in log10 scale.

Figure 3.
Linear regressions between leaf [N] and [P], between leaf [N] and leaf N:P ratio, and between leaf [P] and leaf N:P ratio in Hezuo (A–C) and Maqu (D–F). Solid and dashed lines indicate significant and non-significant regressions, respectively. SFS, WFS, and NFS represent south-, west-, and north-facing slope aspects, respectively. Variables are in log10 scale.

Figure 4.
Comparisons of species richness (A–D) and coverage (E–H) for each plant functional group and the whole community among slope aspects. SFS, WFS, and NFS represent south-, west-, and north-facing slope aspects, respectively. Variables are log10-transformed.
Figure 4.
Comparisons of species richness (A–D) and coverage (E–H) for each plant functional group and the whole community among slope aspects. SFS, WFS, and NFS represent south-, west-, and north-facing slope aspects, respectively. Variables are log10-transformed.

Figure 5.
Correlations of species richness of each plant functional group and the whole community with leaf N concentration (A–D), with leaf P concentration (E–H), and with leaf N:P ratio (I–L). Variables are log10-transformed.
Figure 5.
Correlations of species richness of each plant functional group and the whole community with leaf N concentration (A–D), with leaf P concentration (E–H), and with leaf N:P ratio (I–L). Variables are log10-transformed.

Figure 6.
Correlations of species coverage of each plant functional group and the whole community with leaf N concentration (A–D), with leaf P concentration (E–H), and with leaf N:P ratio (I–L). Variables are log10-transformed.
Figure 6.
Correlations of species coverage of each plant functional group and the whole community with leaf N concentration (A–D), with leaf P concentration (E–H), and with leaf N:P ratio (I–L). Variables are log10-transformed.


Table 1.
Mean value of leaf nitrogen (N) and phosphorus (P) concentrations of the 40 measured species. PFG represents plant functional group.
Table 1.
Mean value of leaf nitrogen (N) and phosphorus (P) concentrations of the 40 measured species. PFG represents plant functional group.
| SPECIES | FAMILY | PFGs | Hezuo | Maqu | ||
|---|---|---|---|---|---|---|
| N (mg g−1) | P (mg g−1) | N (mg g−1) | P (mg g−1) | |||
| Allium beesianum | Amaryllidaceae | Forbs | 16.69 | 1.43 | ||
| Allium condensatum | Amaryllidaceae | Forbs | 16.28 | 1.14 | ||
| Anaphalis hancockii | Asteraceae | Forbs | 17.86 | 1.28 | ||
| Anaphalis lactea | Asteraceae | Forbs | 26.02 | 1.66 | 10.45 | 0.78 |
| Anemone trullifolia var. linearis | Ranunculaceae | Forbs | 13.16 | 1.04 | ||
| Aster tataricus | Asteraceae | Forbs | 11.02 | 0.78 | ||
| Astragalus membranaceus var.membranaceus | Fabaceae | Legumes | 24.52 | 1.73 | 29.29 | 1.83 |
| Bupleurum sp | Apiaceae | Forbs | 14.01 | 1.05 | ||
| Cyperaceae sp | Cyperaceae | Graminoids | 17.30 | 1.24 | ||
| Daucus carota | Apiaceae | Forbs | 7.80 | 0.99 | ||
| Elephantopus scaber | Asteraceae | Forbs | 20.89 | 1.60 | ||
| Fragaria ananassa | Rosaceae | Forbs | 13.33 | 1.65 | ||
| Gentiana macrophylla | Gentianaceae | Forbs | 22.42 | 1.25 | ||
| Gentianopsis barbata | Gentianaceae | Forbs | 14.10 | 1.25 | ||
| Gueldenstaedtia verna | Fabaceae | Legumes | 26.17 | 1.27 | 21.44 | 1.21 |
| Hamamelis mollis | Hamamelidaceae | Shrubs | 17.83 | 1.29 | ||
| Kobresia humilis | Cyperaceae | Graminoids | 14.61 | 1.01 | ||
| Lancea tibetica | Mazaceae | Forbs | 19.10 | 1.53 | ||
| Leontopodium leontopodioides | Asteraceae | Forbs | 13.61 | 0.93 | ||
| Ligularia virgaurea | Asteraceae | Forbs | 11.69 | 1.10 | ||
| Medicago falcata | Fabaceae | Legumes | 4.36 | 1.05 | ||
| Medicago lupulina | Fabaceae | Legumes | 32.35 | 1.90 | ||
| Nardostachys jatamansi | Caprifoliaceae | Forbs | 14.26 | 1.07 | ||
| Nardostachys jatamansi | Caprifoliaceae | Forbs | 8.15 | 0.88 | ||
| Nepeta cataria | Lamiaceae | Forbs | 25.12 | 1.65 | ||
| Oxytropis sp | Fabaceae | Legumes | 36.79 | 2.00 | ||
| Pedicularis szetschuanica | Orobanchaceae | Forbs | 13.38 | 1.94 | ||
| Plantago asiatica | Plantaginaceae | Forbs | 16.07 | 1.56 | ||
| Polygonum macrophyllum | Polygonaceae | Forbs | 9.63 | 1.01 | ||
| Polygonum viviparum | Polygonaceae | Forbs | 25.53 | 1.59 | 15.41 | 1.83 |
| Potentilla anserina | Rosaceae | Forbs | 13.79 | 1.57 | ||
| Potentilla bifurca | Rosaceae | Forbs | 17.76 | 1.25 | ||
| Potentilla fragarioides | Rosaceae | Forbs | 12.92 | 1.03 | ||
| Roegneria kamoji | Poaceae | Graminoids | 18.00 | 1.41 | ||
| Saussurea graminea | Asteraceae | Forbs | 9.40 | 0.54 | ||
| Saussurea graminifolia | Asteraceae | Forbs | 15.92 | 1.39 | ||
| Saussurea sp | Asteraceae | Forbs | 18.62 | 1.20 | 8.77 | 0.84 |
| Scirpus triqueter | Cyperaceae | Graminoids | 17.55 | 0.89 | ||
| Stellera chamaejasme | Thymelaeaceae | Forbs | 36.87 | 2.31 | ||
| Taraxacum sp | Asteraceae | Forbs | 33.27 | 1.85 | ||
Publisher’s Note: MDPI stays neutral with regard to jurisdictional claims in published maps and institutional affiliations. |
© 2022 by the authors. Licensee MDPI, Basel, Switzerland. This article is an open access article distributed under the terms and conditions of the Creative Commons Attribution (CC BY) license (https://creativecommons.org/licenses/by/4.0/).
Share and Cite
MDPI and ACS Style
Li, X.; Hu, Y.; Zhang, R.; Zhao, X.; Qian, C. Linking Leaf N:P Stoichiometry to Species Richness and Composition along a Slope Aspect Gradient in the Eastern Tibetan Meadows. Diversity 2022, 14, 245. https://doi.org/10.3390/d14040245
AMA Style
Li X, Hu Y, Zhang R, Zhao X, Qian C. Linking Leaf N:P Stoichiometry to Species Richness and Composition along a Slope Aspect Gradient in the Eastern Tibetan Meadows. Diversity. 2022; 14(4):245. https://doi.org/10.3390/d14040245
Chicago/Turabian StyleLi, Xin’e, Yafei Hu, Renyi Zhang, Xin Zhao, and Cheng Qian. 2022. "Linking Leaf N:P Stoichiometry to Species Richness and Composition along a Slope Aspect Gradient in the Eastern Tibetan Meadows" Diversity 14, no. 4: 245. https://doi.org/10.3390/d14040245
Note that from the first issue of 2016, this journal uses article numbers instead of page numbers. See further details here.