

Spatiotemporal Variability in Subarctic Lithothamnion glaciale Rhodolith Bed Structural Complexity and Macrofaunal Diversity


1
Department of Biology, Memorial University of Newfoundland, St. John’s, NL A1B 3X9, Canada
2
Department of Ocean Sciences, Ocean Sciences Centre, Memorial University of Newfoundland, St. John’s, NL A1C 5S7, Canada
*
Author to whom correspondence should be addressed.
Diversity 2023, 15(6), 774; https://doi.org/10.3390/d15060774
Submission received: 30 March 2023
/
Revised: 1 June 2023
/
Accepted: 7 June 2023
/
Published: 14 June 2023
(This article belongs to the Special Issue Marine Nearshore Biodiversity)
Abstract
:Rhodoliths are non-geniculate, free-living coralline red algae that can accumulate on the seafloor and form structurally complex benthic habitats supporting diverse communities known as rhodolith beds. We combined in situ rhodolith collections and imagery to quantify variability, over 9 months and at two sites, in the structural complexity and biodiversity of a subarctic Lithothamnion glaciale rhodolith bed. We show that the unconsolidated rhodolith framework is spatially heterogeneous, yet provides a temporally stable habitat to an abundant and highly diverse macrofauna encompassing 108 taxa dominated by brittle stars, chitons, bivalves, gastropods, polychaetes, sea urchins, and sea stars. Specific habitat components, including large bivalve shells, affect rhodolith morphology and resident macrofauna, with increasingly large, non-nucleated rhodoliths hosting higher macrofaunal density, biomass, and diversity than increasingly large, shell-nucleated rhodoliths. The present study’s fine taxonomic resolution results strongly support the notion that rhodolith beds are biodiversity hotspots. Their spatial and temporal domains provide clear quantitative evidence that rhodolith beds provide a stable framework under the main influence of biological forcing until sporadic and unusually intense physical forcing reworks it. Our findings suggest that shallow (<20 m depth) rhodolith beds are vulnerable to ongoing and predicted increases in the frequency and severity of wave storms.
1. Introduction
Habitat structure primarily refers to the composition and spatial arrangement of physical matter at a location [1,2]. Positive relationships between habitat structural complexity and biodiversity have been described in a variety of terrestrial [3,4,5] and aquatic [6,7,8] ecosystems, which build on early investigations relating the availability of inhabitable surfaces to faunal density and diversity [9,10,11]. More recent work suggests habitat complexity can indirectly affect microhabitat and niche availability by shaping foraging activities, intra- and interspecific competition, and predator–prey interactions [12,13,14,15]. Modern definitions of the concept of habitat complexity also include ecosystem engineers (sensu Jones 1994 [16]), i.e., species that create, significantly modify, or maintain habitat structure [17,18,19].
Biodiversity in marine benthic systems generally scales positively with the presence of habitat-forming species such as macroalgae [20,21,22] and marine calcifiers, including bivalves [23] and corals [7]. Rhodoliths are free-living nodules of primarily (>50% in composition) non-geniculate coralline red algae [24,25]. Under favorable conditions, rhodoliths aggregate over extensive areas of the seafloor to form complex benthic habitats supporting diverse communities called rhodolith beds [26]. With their calcium carbonate skeleton, rhodoliths function as autogenic ecosystem engineers [16], providing a three-dimensional, unconsolidated, branching framework (sensu [27]) that macrobenthic organisms can colonize [28]. Rhodoliths exhibit various sizes, shapes, and growth forms, thus significantly contributing to benthic habitat structural complexity [29,30]. They are long-lived (up to 100 years) [31,32] and slow-growing (generally < 1 mm y−1) [33,34,35], and presumably provide stable habitats since water motion is insufficient to move (transport or overturn) rhodoliths [36].
Rhodoliths mainly reproduce through fragmentation but can also originate from spore settlement on hard organic or inorganic particles the coralline tissue eventually overgrows [37]. While in the first case, the resulting new rhodoliths are composed exclusively of algal tissue, the latter condition produces rhodoliths that contain an exogenous core (nucleus). Nucleus size and shape may strongly influence rhodolith morphology and reduce the inner space available for colonization by macrofauna [38,39].
A few studies have linked the high biodiversity generally associated with rhodolith beds to the structural complexity of the habitat they provide [40,41,42]. This functional aspect of rhodolith beds is particularly important given that they normally form over comparatively featureless sedimentary bottoms. Rhodolith beds also act as nursery grounds for several ecologically and economically important species by enhancing the larval settlement of mollusks [43,44], echinoderms [45], corals [46], and sponges [47].
Reports of rhodolith beds along the eastern Canadian seaboard date back more than 70 y [27,48]. Newfoundland rhodoliths are essentially composed of Lithothamnion glaciale, a dominant coralline red alga within the photic zone of subarctic marine environments [49]. A growing number of studies acknowledge the ecological importance of rhodolith beds as biodiversity hotspots [26,28,39]. However, few studies have characterized the spatiotemporal variability of rhodolith bed macrofaunal diversity and structural complexity and their relationship.
The present study builds on pioneering work by Gagnon et al. [30], who provided a general description of rhodolith abundance and morphology, as well as of macrofaunal diversity, in two subarctic rhodolith beds in southeastern Newfoundland. One of these beds, located along the shore of the town of St. Philip’s and hereafter termed the “St. Philip’s bed”, is relatively large (~25,000 m2) and highly biodiverse ([30] and present study). This bed has since been studied for its sedimentary processes [36], calcium carbonate (CaCO3) production [32], resilience to thermal shifts and eutrophication [33,34,35], and trophodynamics [50]. This knowledge base offers an excellent opportunity to further investigate and explain spatial and temporal variability in macrofaunal biodiversity patterns.
We combined in situ rhodolith collections and imagery to quantify seasonal variability in the structural complexity and biodiversity of the St. Philip’s bed. Specifically, we sampled the bed in winter, spring, summer, and fall of the same year at two different locations (sites), to test the hypotheses that (1) the bed’s structure differs between sites, yet is temporally stable within each site; (2) the abundance and diversity of rhodolith macrofauna scale positively with rhodolith size; (3) rhodolith macrofauna differs between sites; and (4) rhodolith macrofauna varies seasonally. These hypotheses stem from prior knowledge (per studies of the St. Philip’s bed cited above) about the biology and ecology of L. glaciale rhodoliths, thermal and hydrodynamic conditions in the St. Philip’s rhodolith bed, and the ontogeny of dominant rhodolith macrofauna.
2. Materials and Methods
2.1. Study Site
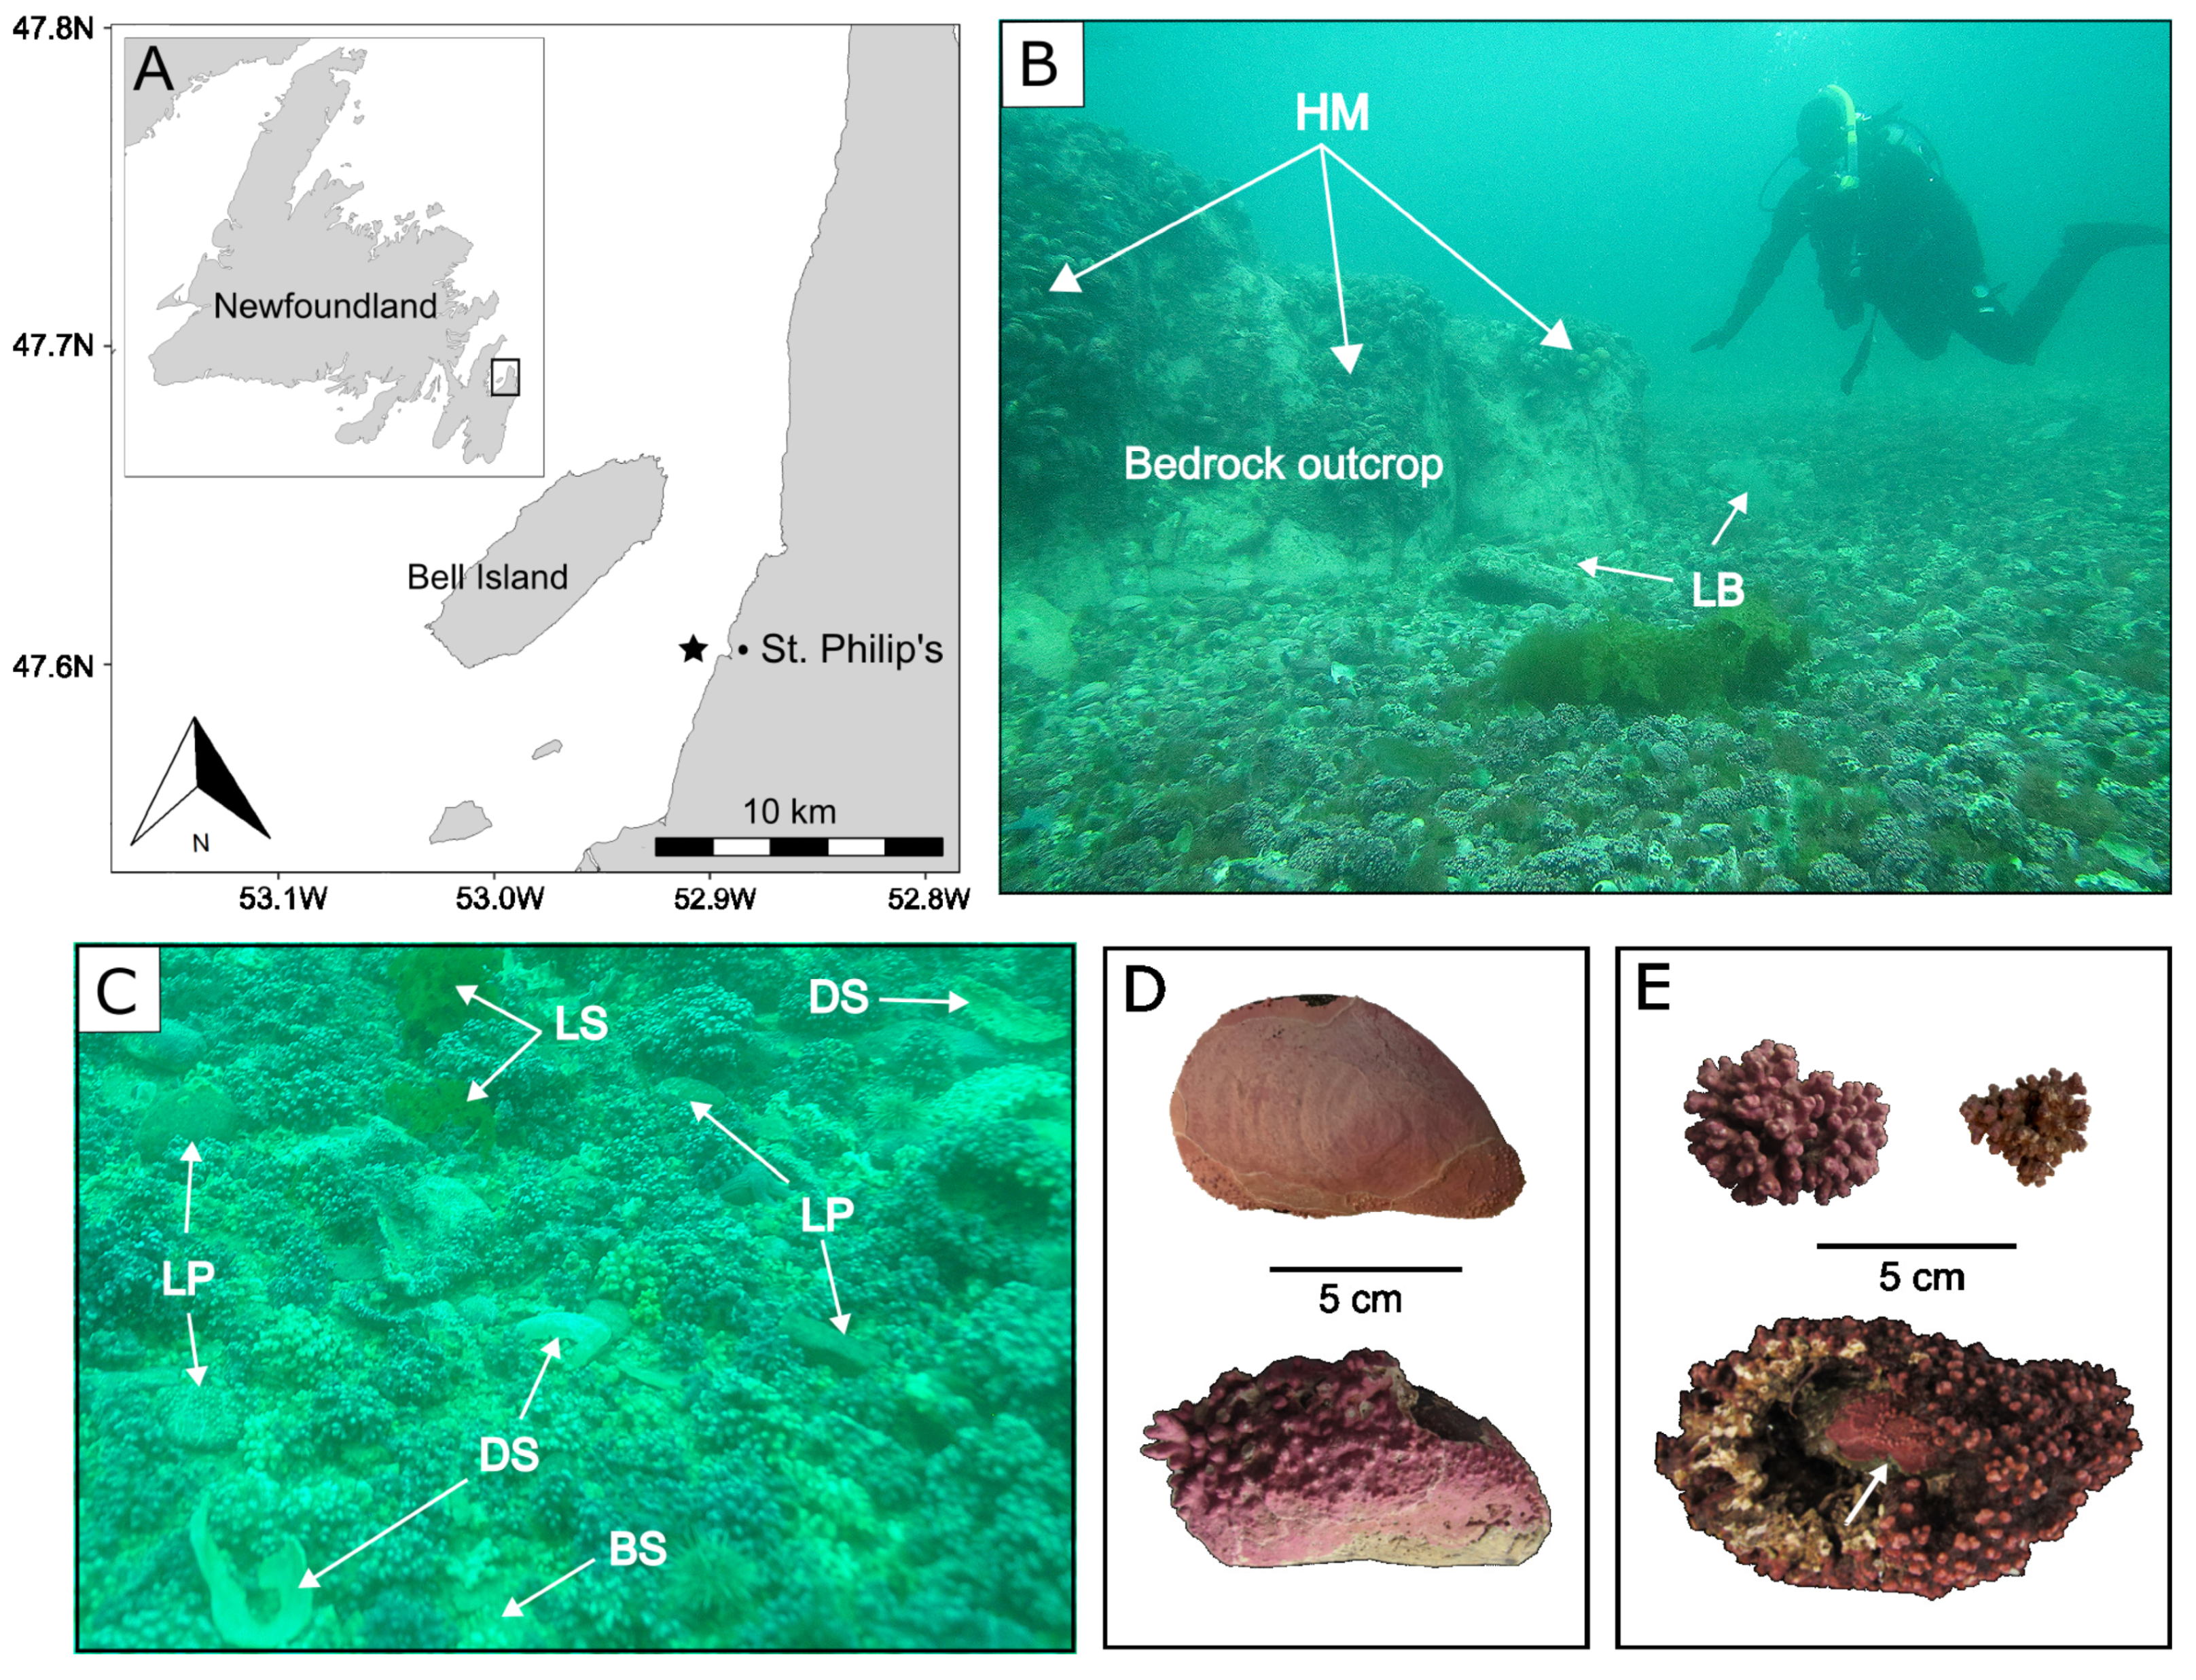
The study system was a rhodolith bed located off the town of St. Philip’s on the eastern shore of Conception Bay, Newfoundland, Canada (Figure 1A). There, the relatively steep rocky seabed extends to a depth of ~10 m, where it grades into a gently sloping sedimentary bottom interspersed with bedrock outcrops rising to up to ~2 m above the seabed (Figure 1B). At depths of 12 to 20 m, large patches of branching (i.e., fruticose, sensu [29]) Lithothamnion glaciale rhodoliths cover a sedimentary bottom primarily composed of coarse biogenic sands; lithic pebbles (hereafter “pebble”); large (~5–10 cm across) disarticulated shells of dead horse mussels (Modiolus modiolus); scattered lithic cobbles/boulders; and loose fragments of brown seaweeds (mainly kelp Agarum clathratum) originating from individuals growing on surrounding bedrock or boulders (Figure 1B,C). We selected two study sites in this bed based on marked differences in seafloor composition and rhodolith size and structure. The first site, SP15, was located at depths of 15–17 m. It was partially enclosed by short (≤50 cm in height) bedrock outcrops and densely covered with mainly praline rhodoliths (sensu [51]), with no external signs of nucleation. The second site, SP18, was at a distance of ~50 m from SP15, at depths of 18–20 m. It was almost entirely enclosed by tall (~2 m) bedrock outcrops (Figure 1B) and differed from SP15 by a noticeably greater occurrence of (1) disarticulated shells of dead horse mussels (Modiolus modiolus) variably covered in coralline red algae; and (2) larger boxwork rhodoliths (sensu [51]), with clear signs of internal nucleation (Figure 1D,E).
2.2. Rhodolith Bed Structure
In 2013, we surveyed both study sites at ~3-month intervals to measure spatial and temporal variations in rhodolith bed structure and rhodolith-associated macrofauna. Sampling was carried out when sea temperature was nearing annual minimal (winter), maximal (summer), and intermediate (spring and fall) values (see Table 1 for sampling dates). On each sampling event, scuba divers acquired video transects of the bed and hand-collected rhodoliths for laboratory analysis.
2.2.1. Bed Composition
On each survey, scuba divers laid on the surface of the bed three 20 m long transects, ~4 m apart from each other. Divers filmed, at a fixed distance of 1.5 m above the bed, both sides of each transect with a submersible video camera system (Sony HDV 1080i/MiniDV with an Amphibico Endeavor housing) equipped with a scaling bar. We converted videos to non-overlapping image frames with VLC Media Player 2.2.3 (VideoLan Organization, Paris, France) and randomly selected 20 frames from each transect. A 0.5 × 1 m digital quadrat was overlaid on each frame with ImageJ version 1.51 (National Institutes of Health, U.S.A., Bethesda, MD) and filled with 50 evenly spaced (10 cm apart) points. We classified the substratum under each point as either of six categories: (1) live rhodolith, (2) dead rhodolith, (3) shell, (4) sediment, (5) pebble, and (6) cobble/boulder. Live or dead rhodoliths consisted of, respectively, pigmented (showing pinkish) or unpigmented (showing whitish) individuals. Shell consisted of large (≥5 cm across) disarticulated shells (whole or fragmented) of horse mussel, Modiolus modiolus. Biogenic sands were coarse grains dominated by small (<0.4 cm) fragments of dead rhodoliths. Per the Wentworth scale for grain size classification [52], we categorized lithic fragments with a maximum diameter of 4–64 mm and >64 mm, as pebble and cobble/boulder, respectively. Given their rare occurrence, we merged cobbles and boulders into a single category (category 6 above). Loose seaweed fragments were ephemeral components of the rhodolith bed and hence were not considered a substratum type. Bed composition for each transect was estimated by summing the occurrences of substratum types under each of the 50 points within each digital quadrat. We repeated this procedure for each of the 20 image frames of each transect, for a total of 1000 occurrences per transect.
2.2.2. Rhodolith Abundance and Morphology
Upon completing transect videoing, divers hand-collected all rhodoliths within three 30 × 30 cm (0.09 m2) quadrats placed on the right side of each transect at 2, 10, and 18 m marks, for a total of 72 quadrats (3 quadrats × 3 transects × 2 sites × 4 surveys). The systematic placement of quadrats at predetermined distances along transects ensured unbiased sampling. Rhodoliths from each quadrat were brought to the sea surface in numbered, seawater-filled, sealed plastic bags, and transported to the Ocean Sciences Centre (OSC) of Memorial University of Newfoundland. Upon arrival at the OSC, bags with their seawater and rhodoliths content were placed in large flow-through tanks supplied with ambient seawater pumped in from a depth of ~5 m in the adjacent embayment, Logy Bay. Water in each bag was replaced with new seawater from the tanks three times daily until the completion of the measurements described below.
For each quadrat sample, we counted all rhodoliths and measured their longest (L), intermediate (I), and shortest (S) axes to determine their size (volume) and shape. The volume of each rhodolith was estimated with the following equation:
where V is the volume of an ellipsoid, a denotes the radius of the longest axis (L/2), b denotes the radius of the intermediate axis (I/2), and c is the radius of the shortest axis (S/2). We summed the volume of all rhodoliths in each quadrat, hereafter referred to as “rhodolith volume” (per 0.09 m2 quadrat), to investigate the relationship between rhodolith volume and macrofaunal density, biomass, and diversity (see Section 2.3 and Section 2.4).
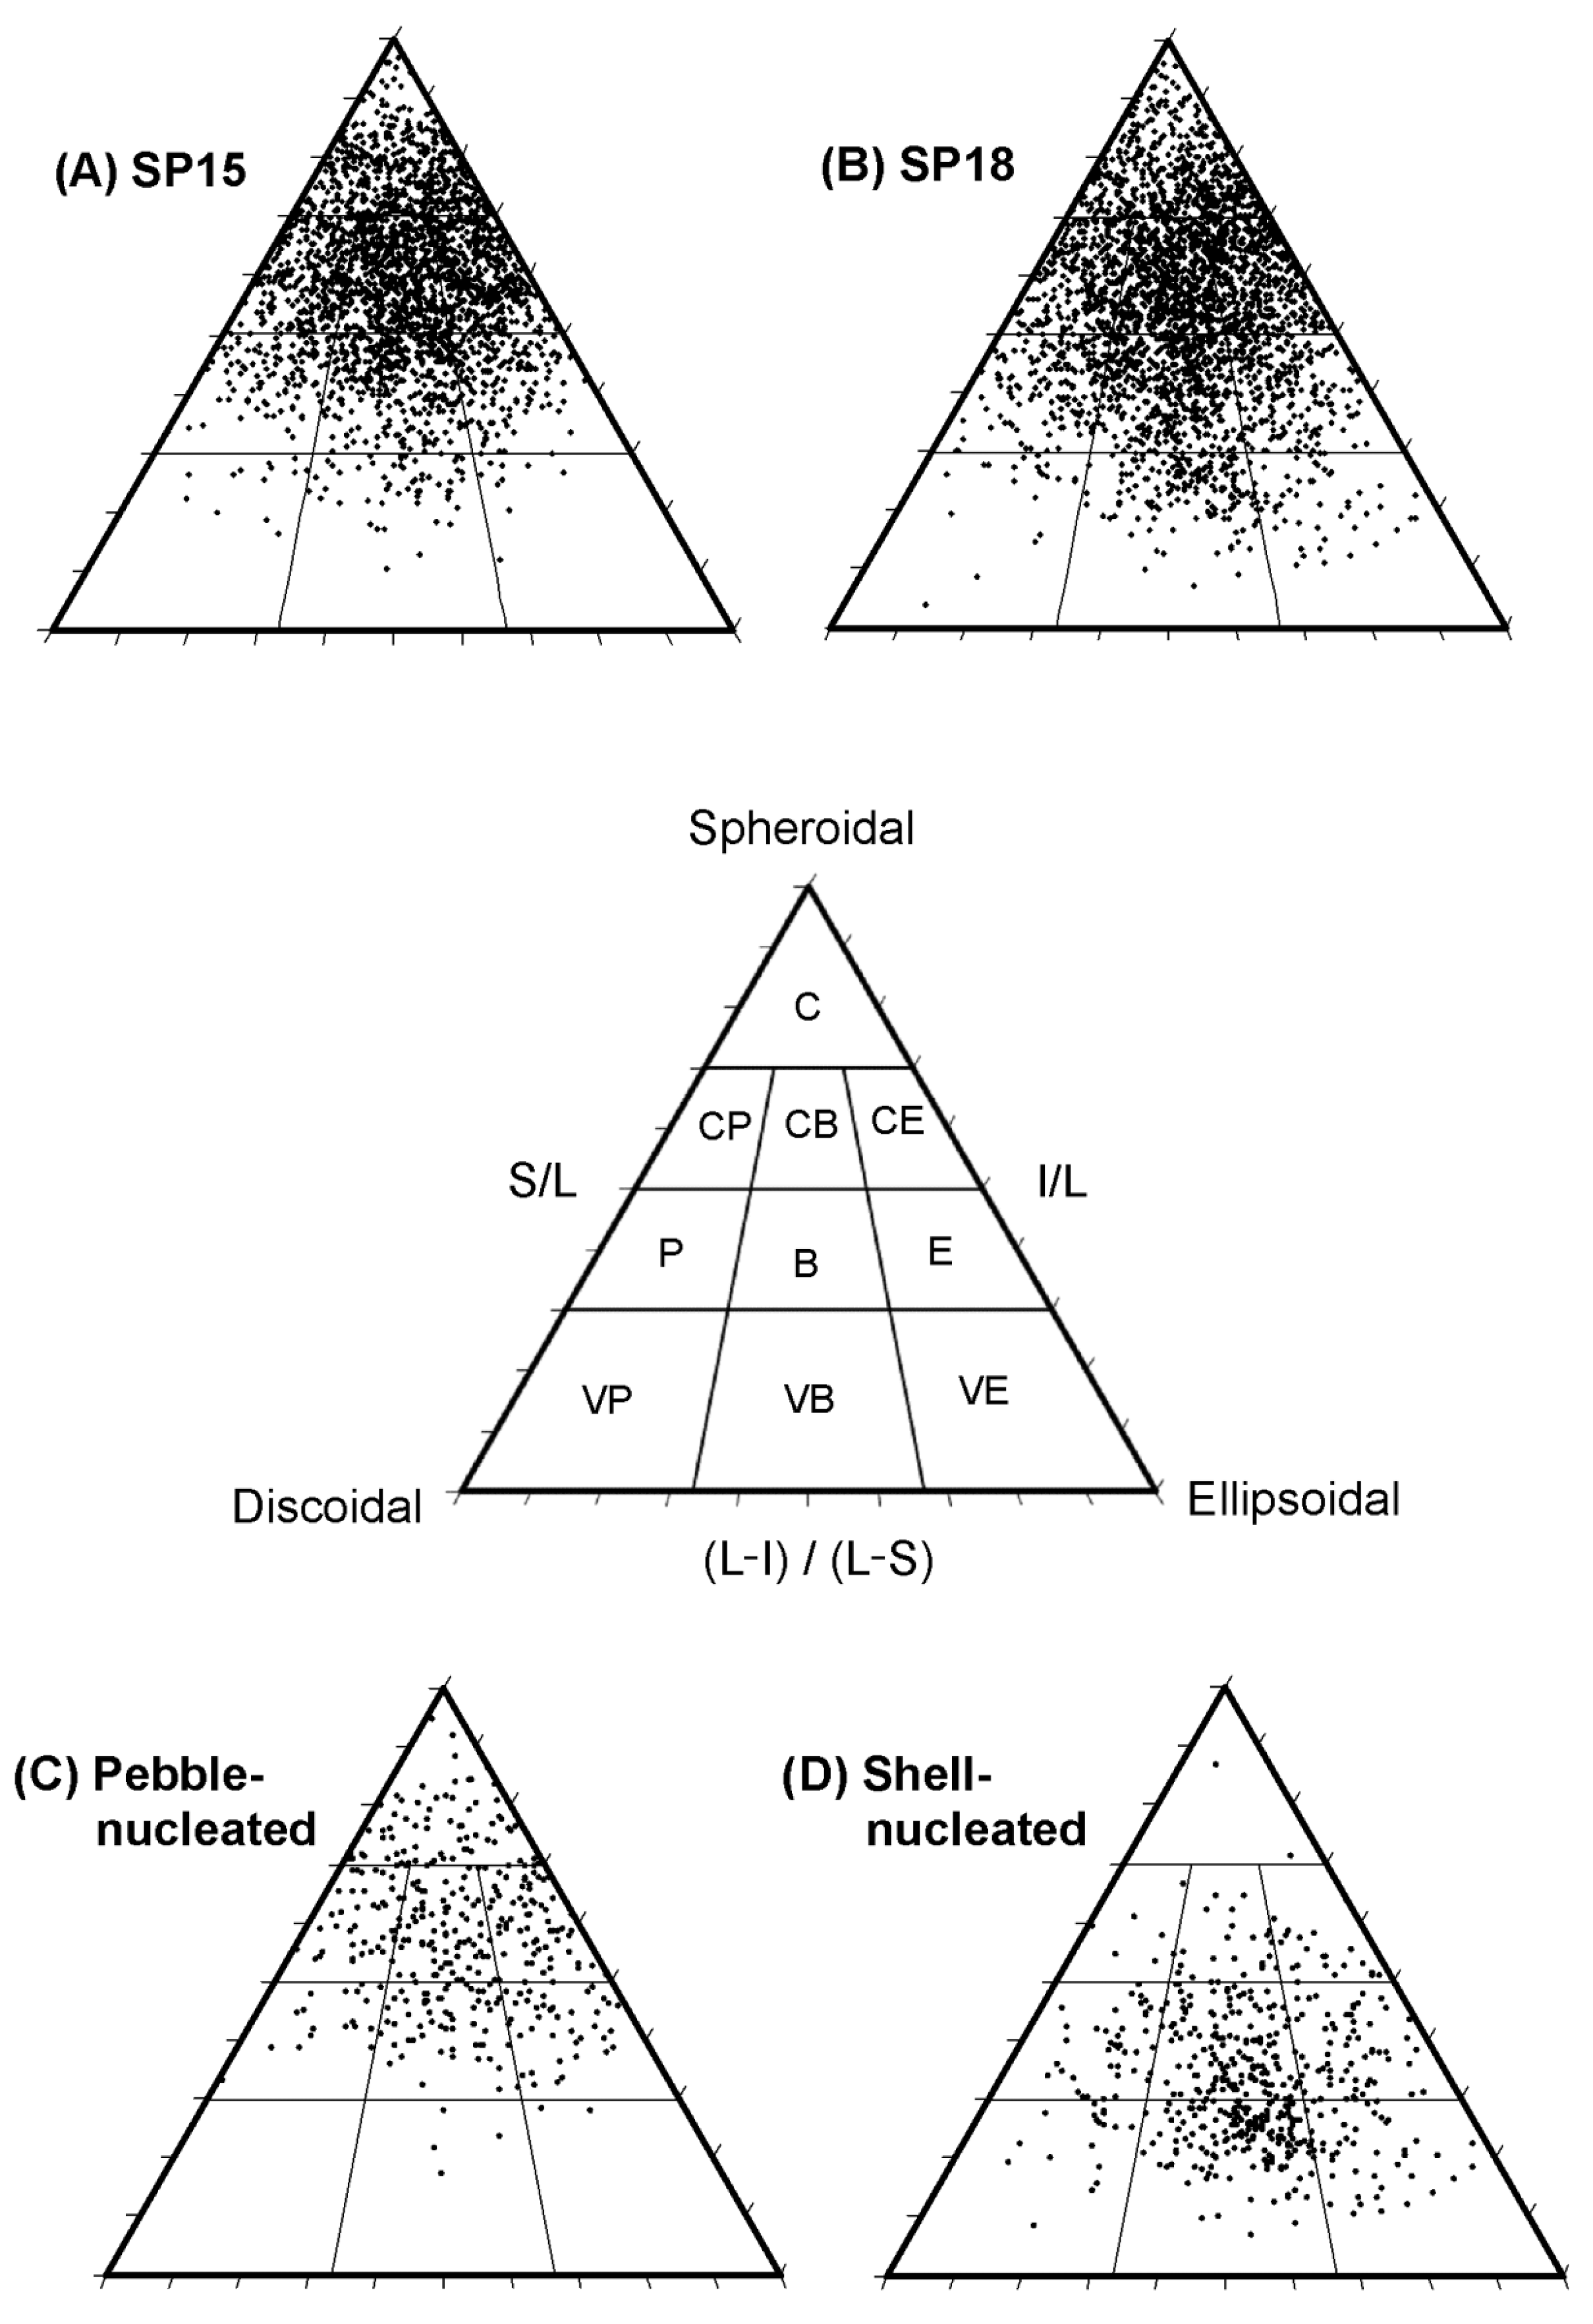
We used ternary diagrams created with the open source software TRIPLOT developed by Graham and Midgley [53] and based on work by Sneed and Folk [54] on particle shapes to plot variation in rhodolith shape distribution: (1) within and between the two sites, and (2) among non-nucleated, pebble-nucleated, and shell-nucleated rhodoliths. The software uses mathematical relationships between the three rhodolith axes (S/L, I/L, and (L-)/L-S)) to assign each rhodolith to 1 of the 10 categories lying in a continuum of shapes between spheroidal, discoidal, and ellipsoidal [25]. Compact, compact–platy, compact–bladed, and compact–elongate rhodoliths are largely spheroidal, whereas platy and very-platy rhodoliths, or elongate and very elongate rhodoliths, are comparatively more discoidal and ellipsoidal, respectively. Bladed and very bladed rhodoliths are in between discoidal and ellipsoidal. We analyzed rhodolith shapes according to Sneed and Folk’s [54] four main shape categories (compact, platy, bladed, and elongate) because the majority of rhodoliths at our two study sites were between discoidal and ellipsoidal (i.e., bladed or very bladed). We broke all rhodoliths into ~2 cm3 fragments to determine the presence and type of nucleus (pebble or shell). We determined total rhodolith biomass per quadrat after removing all nuclei and macrofauna (see Section 2.3) and oven drying the rhodolith fragments at 40 °C to constant weight.
2.3. Macrofaunal Density, Biomass, and Diversity
For each quadrat sample, we inspected rhodolith fragments and carefully extracted all visible macrofauna with tweezers and forceps. We transferred the fragments into a 5 L bucket filled with filtered seawater and manually stirred for ~1 min to dislodge the remaining macrofauna. The content was further poured onto a 5 mm mesh sieve, which retained rhodolith fragments, and was placed atop a 500 µm mesh sieve, which retained all the remaining macrofauna. Macrofauna was preserved in a solution of 4% formaldehyde mixed with seawater.
We sorted macrofauna from each sample into 12 taxonomic groups (Ophiuroidea, Asteroidea, Echinoidea, Holothuroidea, Polyplacophora, Gastropoda, Bivalvia, Polychaeta, Crustacea, Porifera, Nemertea, and Sipuncula) and measured, using a balance with a precision of ±0.001 g (PB3002-S/FACT; Mettler Toledo, Columbus, OH, USA), the total wet weight for each group after gently blotting the samples. We chose to express macrofaunal biomass in wet weight rather than dry weight to preserve the samples for future biodiversity analyses. We identified and tallied all organisms to the lowest possible taxonomic rank. Because of the time constraints associated with the identification of high numbers of small and often juvenile specimens, we limited the identification of polychaetes to family. However, using one randomly chosen sample per site and per season (n = 8 samples), we produced a list of all the identifiable polychaete species. Sponges were highly fragmented and could only be tallied as present or absent. For each sample, we calculated (1) macrofaunal density by dividing the total number of the collected organisms by the quadrat surface area (0.09 m2); and (2) the Shannon diversity index (H).
We used American Seashells [55] as the main guide for mollusk identification. We used detailed identification keys by Pettitbone [56], Fauchald [57], Appy et al. [58], and Pocklington [59] to identify polychaetes families and species. Amphipods were identified by professional taxonomists. We used field guides by Gosner [60], Pollock [61], Abbott and Morris [62], and Squires [63] to complete invertebrate identification.
2.4. Statistical Analysis
2.4.1. Rhodolith Bed Structure
We used a two-way permutational multivariate analysis of variance (PERMANOVA) (Anderson [64]) with the fixed factors of Site (SP15 and SP18) and Season (winter, spring, summer, and fall) to compare spatial and seasonal variability in (1) seafloor composition based on six substratum types, namely live rhodolith, dead rhodolith, shell, sand, pebble, and cobble/boulder (n = 24; 3 transects × 2 sites × 4 seasons); and (2) rhodolith shape based on four shape categories derived from Sneed and Folk’s [54] ternary diagram: compact (i.e., compact, compact–platy, compact–bladed, and compact–elongate), platy (platy and very platy), bladed (bladed and very bladed), and elongate (elongate and very elongate) (n = 72; 9 quadrats × 2 sites × 4 seasons). We used a negative binomial regression [65] with the fixed factor of Site (SP15 and SP18) to compare rhodolith density (counts per quadrat) between the two sites with a negative binomial distribution, which best accounted for overdispersion of rhodolith count data. We used two two-way ANOVAs, each with the fixed factors of Site (SP15 and SP18) and Season (winter, spring, summer, and fall) to compare (1) rhodolith biomass and (2) rhodolith volume between the sites (n = 72 for each ANOVA; 2 sites × 9 quadrats per site × 4 collections). Two binomial regressions [65] with the fixed factor of Site, enabled the comparison of (1) the proportion of nucleated rhodoliths (nucleated or non-nucleated) and (2) the proportion of each nucleus type (pebble or shell) between the sites (n = 72 each; 2 sites × 9 quadrats per sites × 4 collections).
2.4.2. Macrofaunal Density, Biomass, and Diversity
As rhodolith volume increases, so does the space available for colonization by macrofauna between rhodolith branches. Therefore, we included rhodolith volume as an explanatory variable in our analyses of macrofaunal density, biomass, and diversity. We used two analyses of covariance (ANCOVA), each with the fixed factors of Site (SP15 and SP18) and Season (winter, spring, summer, and fall) and covariate Volume (total rhodolith volume per quadrat) to compare macrofaunal biomass and diversity (the Shannon diversity index) between sites and among seasons. We used negative binomial regressions to model overdispersed invertebrate counts with the fixed factors of Site (SP15 and SP18) and Season (winter, spring, summer, and fall) to compare macrofaunal density between sites and among seasons.
All analyses (except PERMANOVAs) were performed on untransformed data; however, the densities and biomass values of rhodolith and macrofauna are reported in the text and figures as values per meter square (rather than values per 0.09 m2 quadrat) to facilitate the comparison with data in the literature. For all ANOVAs and ANCOVAs, we verified the homogeneity of the variance and normality of the residuals by examining the distribution and normal probability plots of the residuals, respectively [66]. Tukey HSD multiple comparison tests based on least-square means were used to detect the differences among levels within a factor. All statistical analyses were carried out with R 3.6.1 R (R Core Team 2019) [67]. We used R packages MASS [68] and VEGAN [69] to fit generalized linear models (binomial and negative binomial regressions) and PERMANOVA, respectively. PERMANOVA only included species/taxa that accounted for at least 0.1% of total macrofaunal abundance (52 taxa) and were based on Bray–Curtis dissimilarity for square-root-transformed data. We used pairwise comparisons to detect the differences among levels within factors and similarity percentage (SIMPER) analyses, with 9999 permutations to quantify the contribution of each taxon to overall between-group dissimilarity. All analyses used a 5% significance level (α = 0.05). All means are presented with a 95% confidence interval (mean ± 95% CI) unless stated otherwise. Analysis of variance/deviance tables and detailed SIMPER outputs are presented in Supplement S1 and Supplement S3, respectively.
3. Results
3.1. Rhodolith Bed Habitat Structure
3.1.1. Seafloor Composition
Live rhodolith and sediment were the most frequent substratum types, with mean percent cover of 63% and 23%, respectively, followed by dead rhodolith, with 9% surface cover, pebble (3.6%), shell (2.4%), and cobble/boulder (˂1%). PERMANOVA showed spatial variation in substratum type (Table S1; Figure 2A), whereas SIMPER analysis revealed that the seven-times lower percent cover of shells at SP15 compared with SP18 explained 30% of the dissimilarity between the two sites (Table S8). PERMANOVA also showed seasonal variation in seafloor composition. However, post hoc pairwise comparison detected differences at a 10% significance level (p = 0.096) only, and SIMPER analysis revealed that the higher percent cover of sediment, pebbles, and shells in winter, compared with fall, explained 64% of the dissimilarity between these seasons (Tables S1A and S8; Figure 2A).
3.1.2. Rhodolith Abundance and Morphology
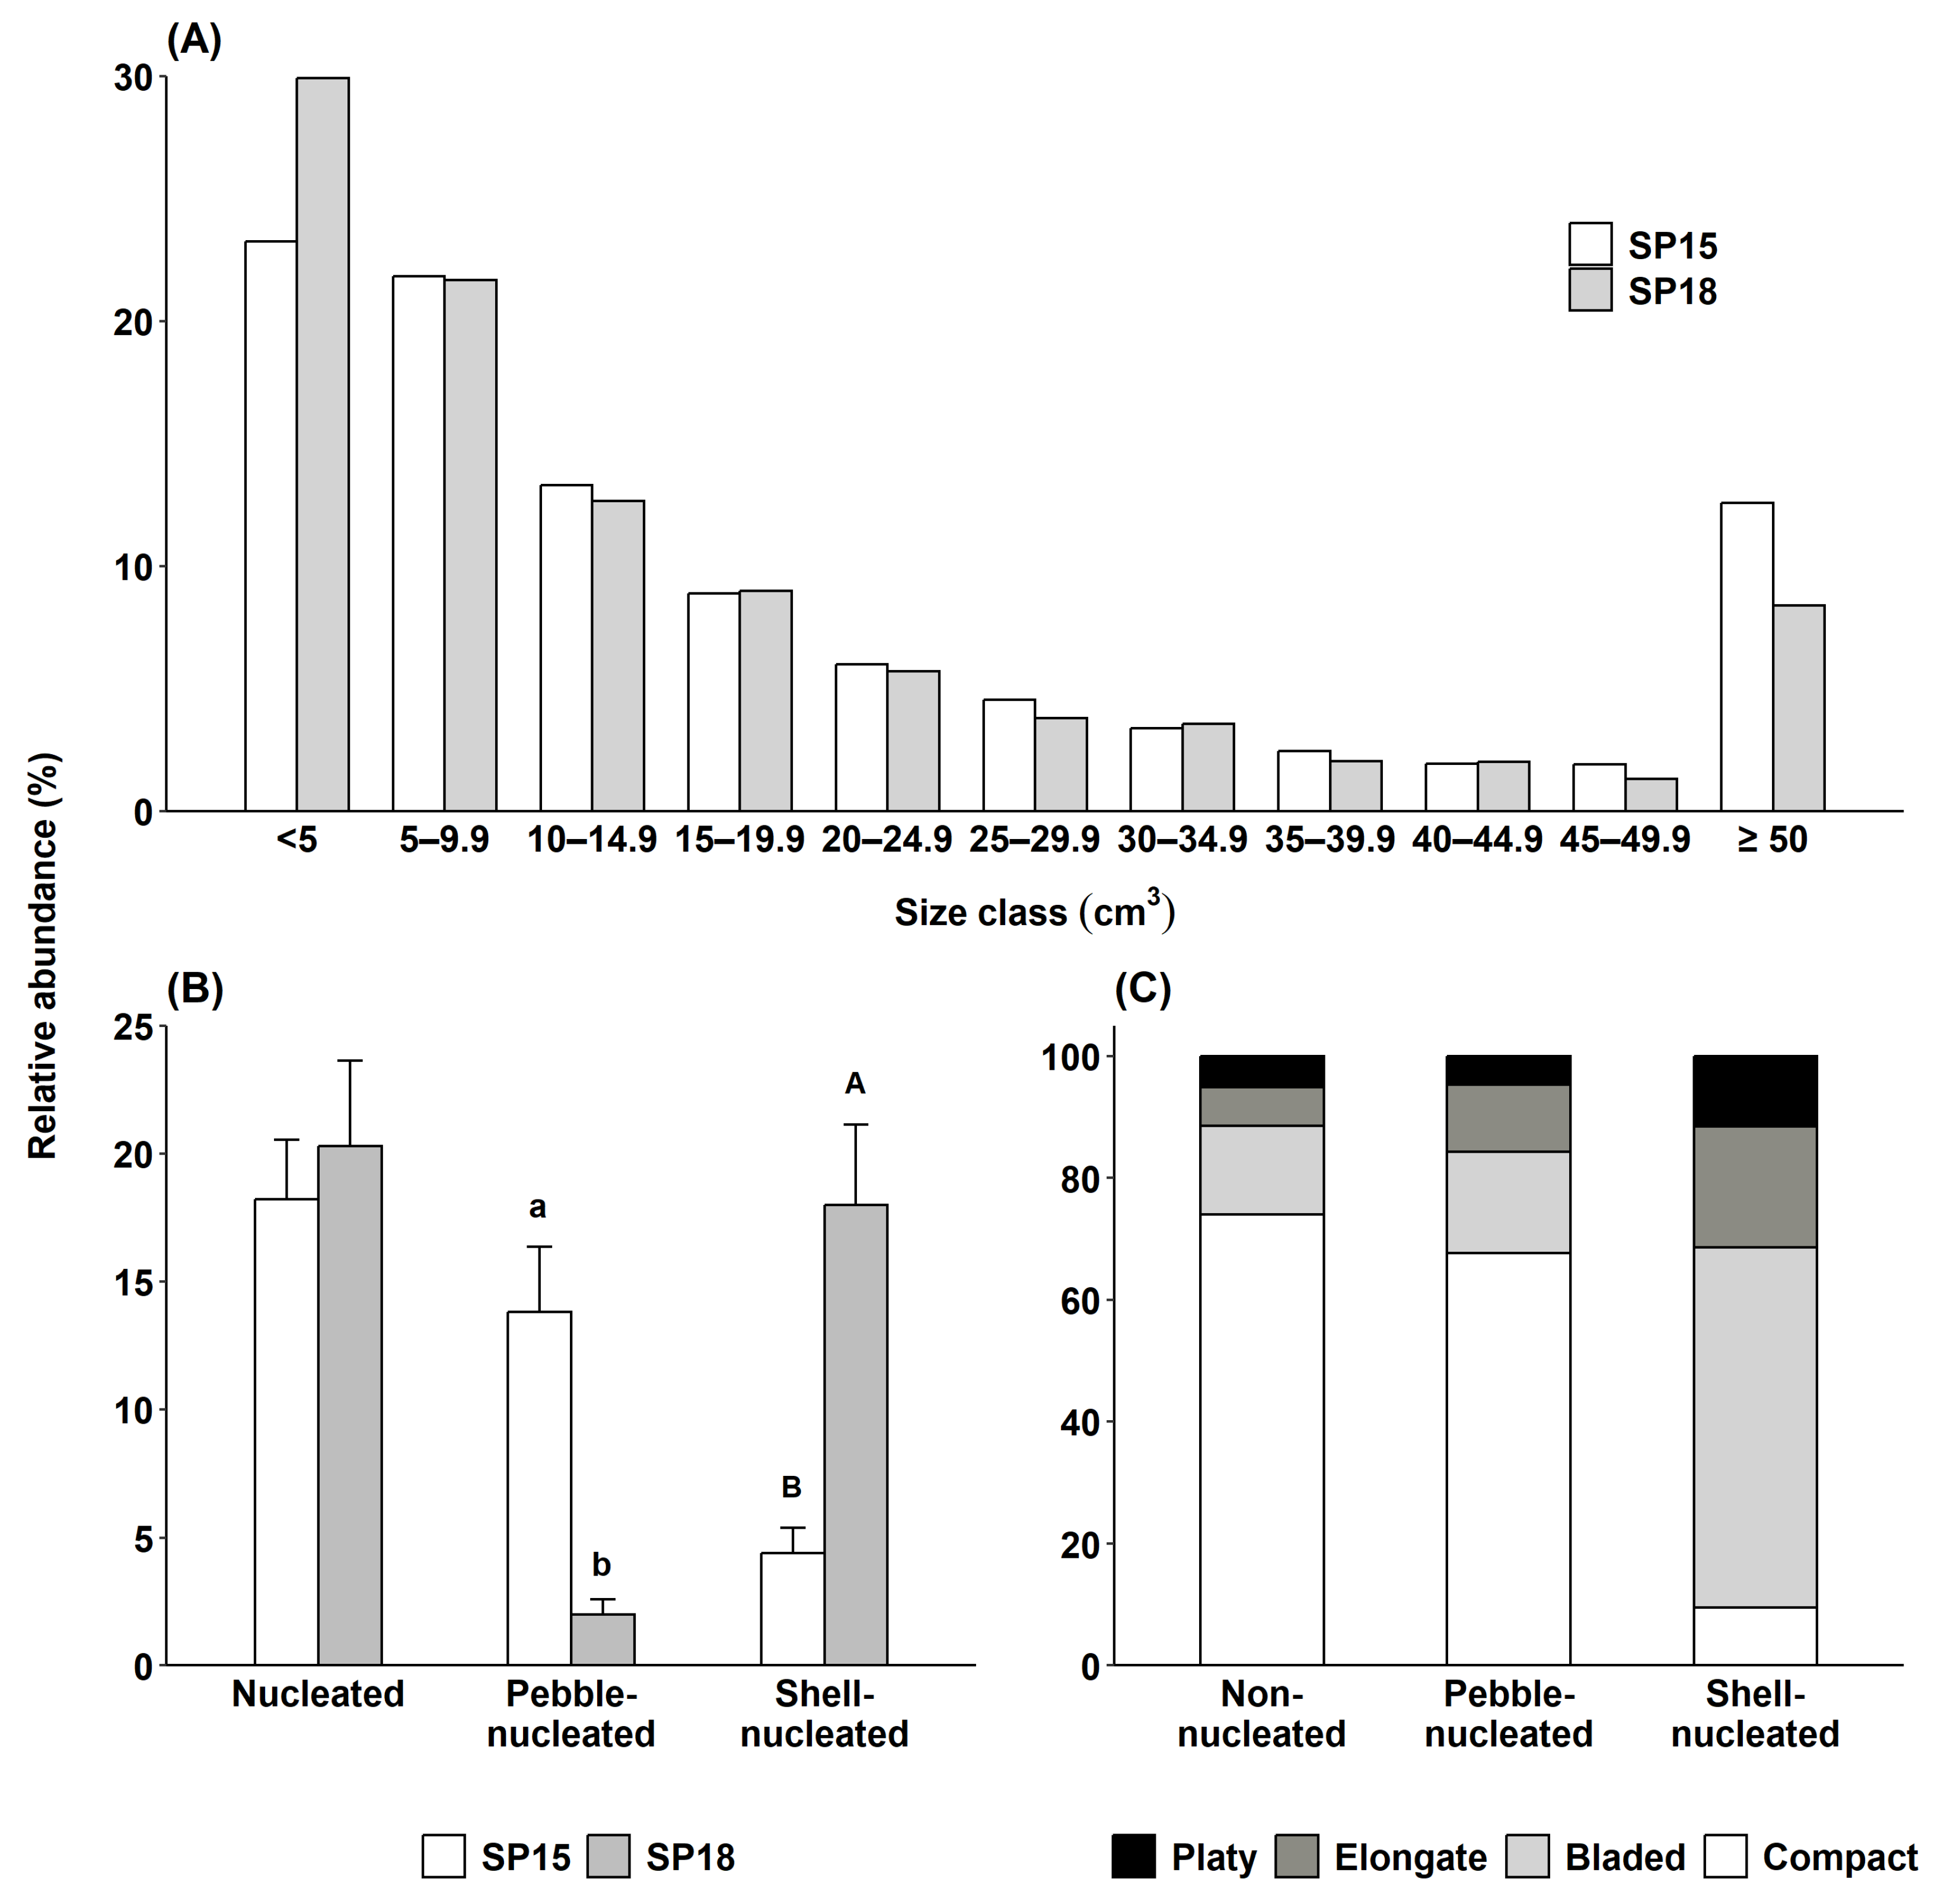
Rhodolith density and biomass did not differ between sites or among seasons (Tables S2A and S3A), averaging 822 ± 44 individuals m−2 and 11.54 ± 0.47 kg rhodoliths m−2, respectively. Rhodoliths ranged in size from 0.6 to 527.2 cm3 at SP15, and from 0.2 to 392.0 cm3 at SP18, for a mean rhodolith size 1.4 times greater at SP15 (25.6 ± 0.87 cm3) than at SP18 (18.8 ± 0.54 cm3). Rhodolith distributions for the 5–50 cm3 size classes were similar at both sites, but the proportion of smaller (<5 cm3) and larger (>50 cm3) rhodoliths was 7% lower and 5% higher at SP15 than at SP18, respectively (Figure 3A). Rhodolith volume was 1.4 times higher at SP15 (25,600 ± 870 cm3) than at SP18 (18,800 ± 540 cm3) but did not vary seasonally (Table S3B).
The proportion of nucleated rhodoliths was similar at both sites (Table S2B), averaging 18 ± 1% at SP15 and 20 ± 2% at SP18 (Figure 3B). Nuclei consisted of either small pebbles or entire or fragmented horse mussel (Modiolus modiolus) shells, except for one gastropod shell and one small (~2 cm) piece of wood. The proportion of the two main nucleus types (pebble and shell), however, differed between sites (Table S2C), with seven times more pebble-nucleated, and four times fewer shell-nucleated rhodoliths at SP15 than SP18 (Figure 3B). Large (≥50 cm3) rhodoliths were 47% nucleated at SP15, including 34% pebble-nucleated rhodoliths. At SP18, the proportion of rhodoliths increased to 68%, including 61% shell-nucleated rhodoliths.
Compact shapes (i.e., rhodoliths in any one of the four compact shape classes) dominated SP15 (73%) and SP18 (62%) rhodoliths, followed by bladed (bladed and very-bladed; 16% and 22%), elongate (elongate or very elongate; 6% and 9%), and platy (platy or very platy; 5% and 6%) shapes (Figure 4A,B). PERMANOVA showed a significant spatial variation in rhodolith shape, whereas SIMPER analysis revealed that the higher proportion of compact rhodoliths and lower proportion of bladed, elongate, and platy rhodoliths at SP15, compared with SP18, explained 16% of the dissimilarity between the two sites (Tables S1B and S9; Figure 2B). Rhodolith shapes also varied seasonally, with a higher proportion of compact rhodoliths and a lower proportion of three other shapes, which explained 19% of the dissimilarity between winter and fall (Tables S1B and S9; Figure 2B).
Rhodolith shape distribution was similar in non-nucleated and pebble-nucleated rhodoliths, with compact shapes dominating, followed by bladed, elongate, and platy shapes (Figure 3C). Shell-nucleated rhodoliths were predominantly bladed or elongate (79%), whereas compact shapes were the least represented (9%) (Figure 3C and Figure 4D). The proportions of bladed and elongate shapes were, on average, 3.8 and 2.5 times higher in shell-nucleated than in non-nucleated or pebble-nucleated rhodoliths, respectively (Figure 3C and Figure 4).
3.2. Rhodolith Macrofauna
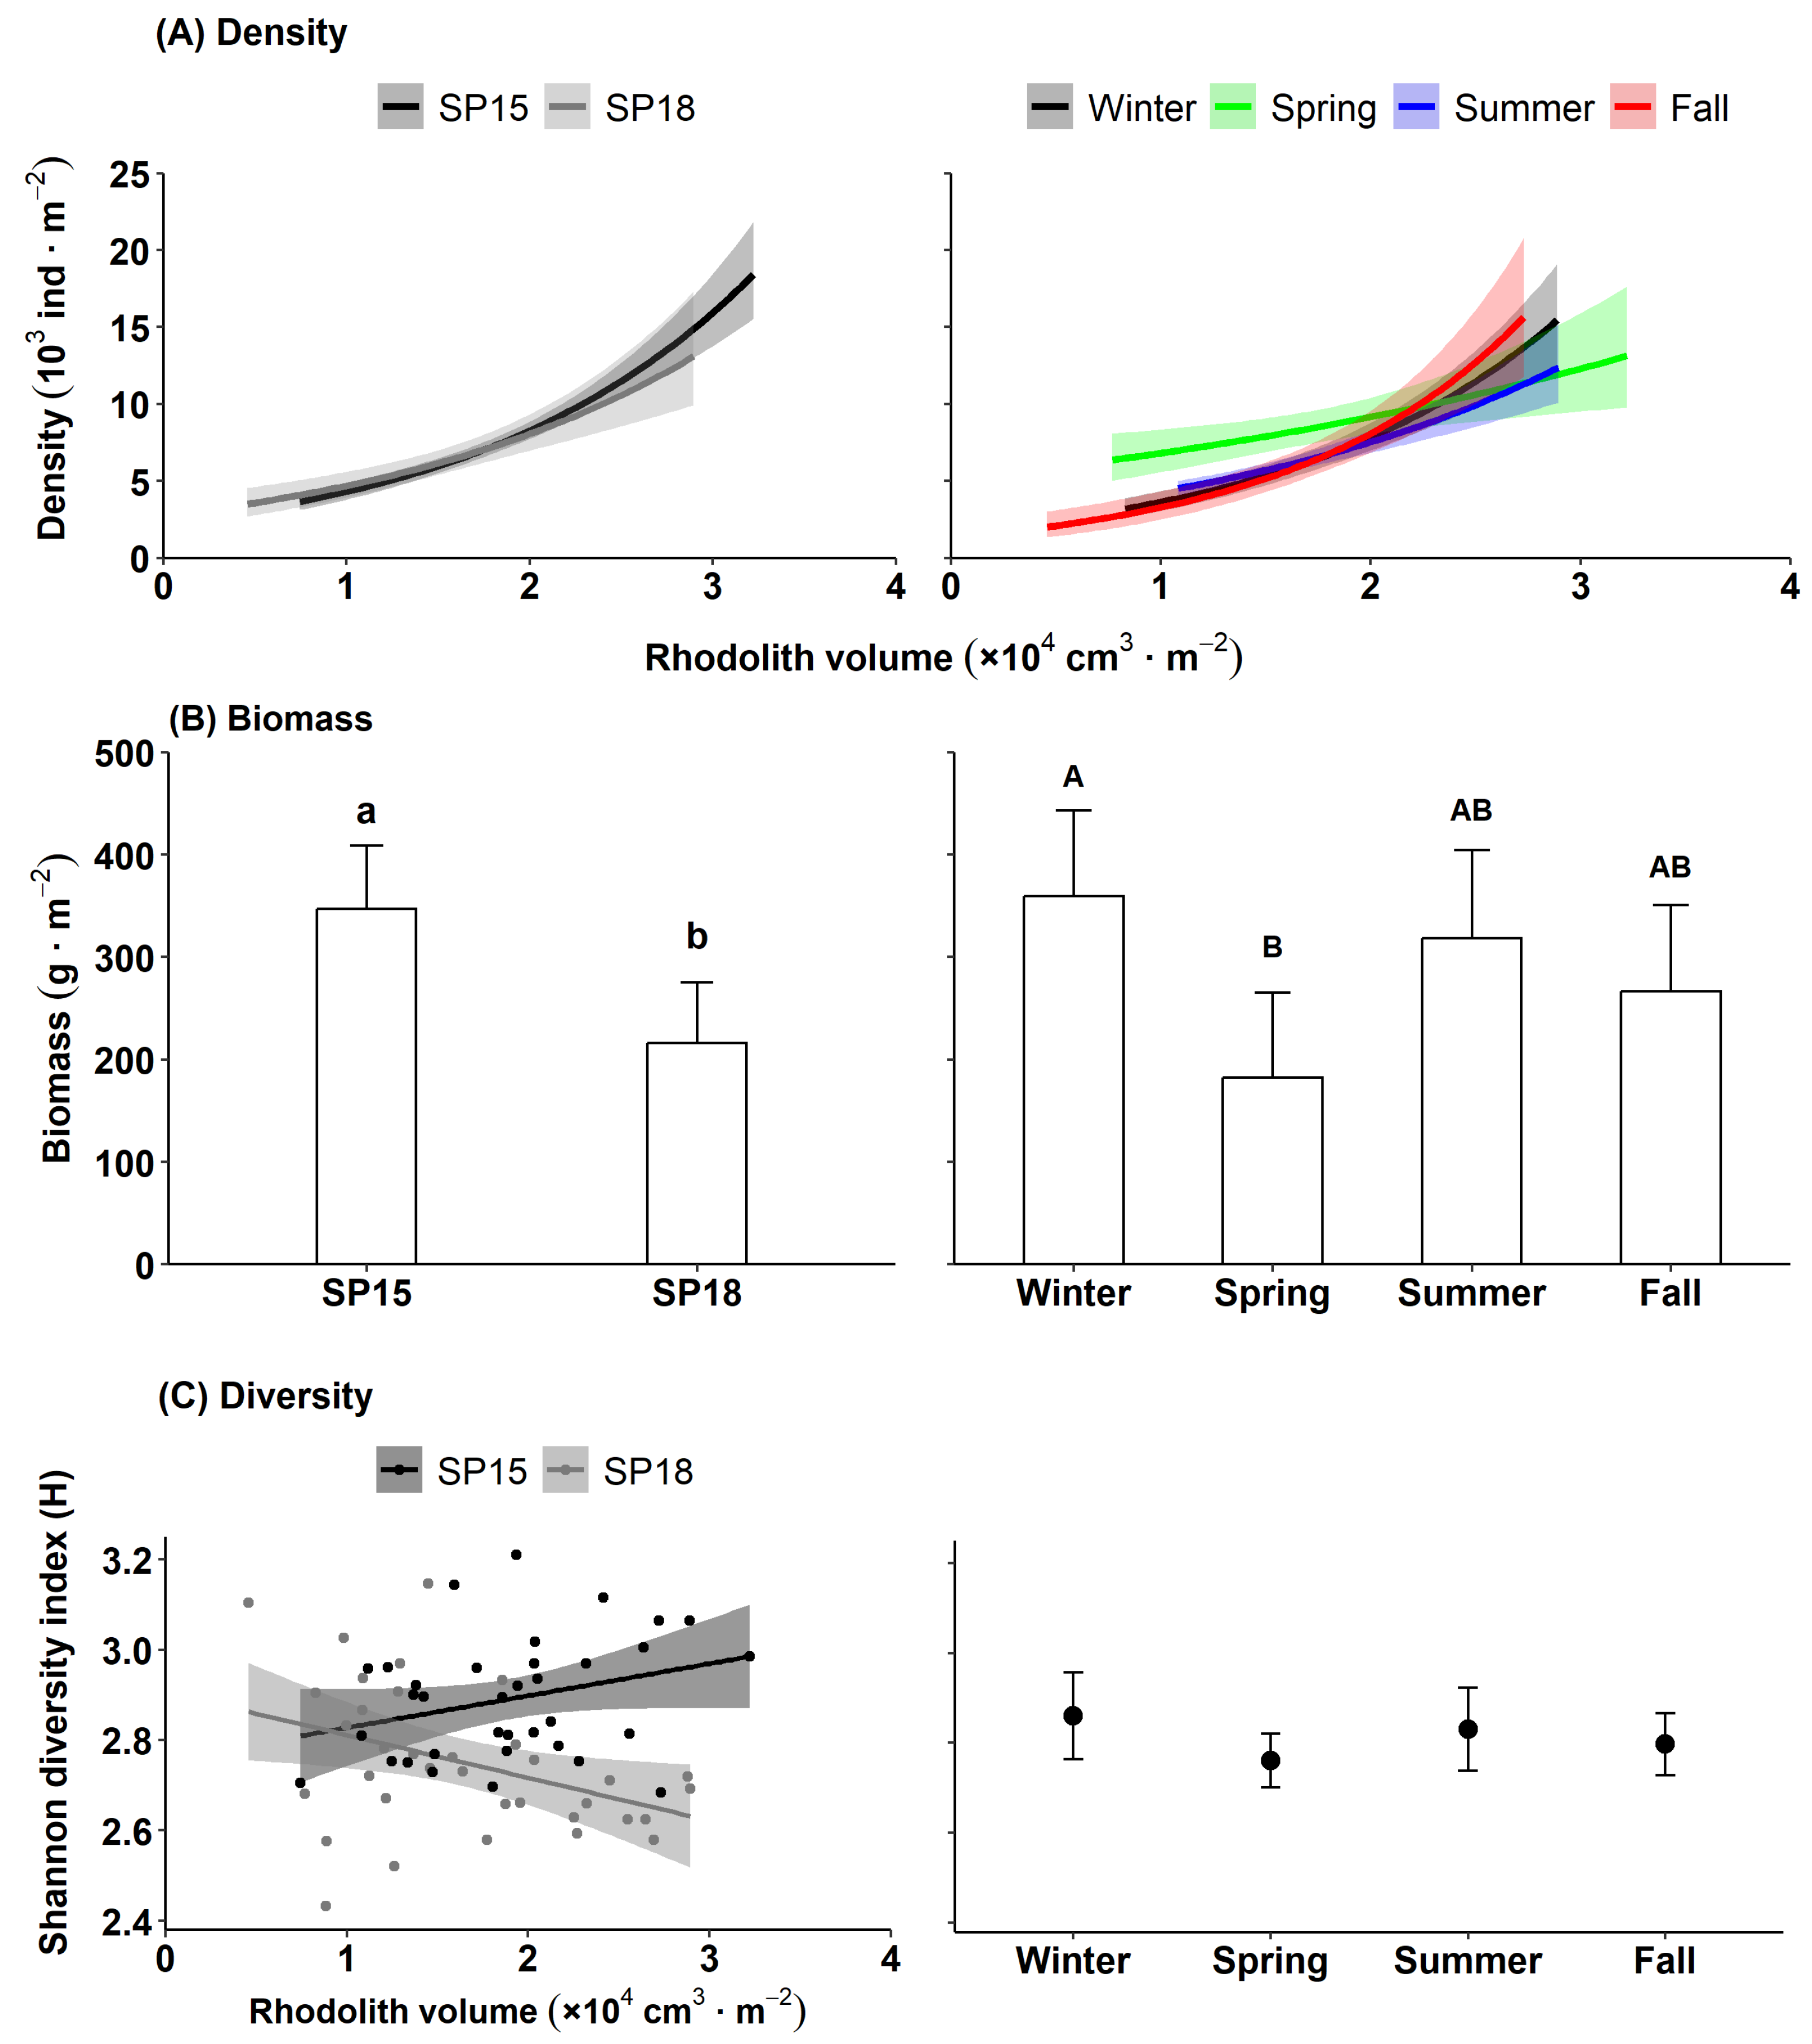
We counted and identified 50,775 specimens from 108 taxa (Table S7). Brittle stars and chitons numerically dominated macrofaunal abundance, accounting for 36% and 18% of total specimens, respectively. Polychaetes, gastropods, and bivalves accounted for 14%, 11%, and 7% of total abundance, respectively, followed by urchins (4%), amphipods (3%), sea stars and isopods (2% each), and nemerteans and sipunculids (1% each) (Table S7). Sea cucumbers, decapods, ostracods, tunicates, platyhelminthes, and cnidarians also occurred in low (<1%) abundance (Table S7). Small fragments of sponges (Sycon sp.) and colonial tunicates (Didemnum sp.) were present at both sites and in all seasons (Table S7). Nearly 50% of the polychaetes belonged to the families Sabellidae (mainly Pseudopotamilla reniformis, 33%) and Terrebellidae (15%), while the wrinkled rock borer (Hiatella arctica) made up 82% of all bivalves. Macrofaunal density ranged from 911 to 25,240 individuals m−2 and increased with rhodolith volume at a similar rate at both sites, averaging 7833 ± 444 (SE) individuals m−2 (Table S4; Figure 5A). Density also scaled positively with rhodolith volume in all seasons, but it increased at a lower rate and was on average 25% higher in spring (8878 ± 689 individuals m−2) than in the other seasons (7193 ± 796 individuals m−2; Table S4; Figure 5A).
Macrofaunal biomass ranged from 38.9 g m−2 to 1.153 kg m−2 and was dominated by brittle stars (64%) and sea urchins (13%), followed by chitons and bivalves (8% each), polychaetes (4%), sea stars (2%), and gastropods and nemerteans (1% each). Sponges, crustaceans, sipunculids, and sea cucumbers each accounted for <1% of the biomass. Mean biomass did not vary significantly with rhodolith volume, was 1.6 times higher at SP15 (346.7 ± 31.1 g m−2) than at SP18 (216.7 ± 30.0 g m−2), and 2 times higher in spring (32.4 ± 3.8 g) (360.0 ± 42.2 g m−2) than in summer (16.4 ± 3.7 g) (182.2 ± 41.1 g m−2) (Table S5, Figure 5B). Macrofaunal diversity did not vary significantly among seasons but increased with the rhodolith volume at SP15 and was negatively related to rhodolith volume at SP18 (Table S6, Figure 5C).
PERMANOVA analysis indicated that macrofaunal assemblages varied spatially. SIMPER analysis showed that the higher abundance of daisy brittle stars (Ophiura aculeata), mottled chitons (Tonicella marmorea), wrinkled rock borer clams (Hiatella arctica), sabellid polychaetes, and keyhole limpets (Puncturella noachina), together with lower abundance of brittle stars (Ophiopholis robusta) and northern white chitons (Stenosemus albus), explained 62% of the dissimilarity between the two sites (Tables S1C and S10, Figure 6A). Macrofaunal assemblages also varied seasonally, with SIMPER analysis indicating that a higher abundance of the same seven taxa noted above accounted for ~65% of the dissimilarity between spring and the three other seasons (Tables S1C and S10; Figure 6B). The only exception was the lower abundance of brittle stars (O. aculeata) in spring than in fall (Table S10). All 52 taxa included in the PERMANOVA analysis (see Section 2.4) were present at both sites and in all seasons. The seven taxa that contributed most to the spatial and seasonal dissimilarities mentioned above accounted for 69% of all the specimens identified.
4. Discussion
Our nine-month survey of a subarctic rhodolith (Lithothamnion glaciale) bed revealed a stable, unconsolidated rhodolith framework containing a highly diverse macrofaunal community of at least 108 taxa. We found that (1) substratum types varied seasonally and between the shallow (SP15; 15 to 17 m deep) and deeper (SP18; 18 to 20 m deep) study sites but that rhodolith density and biomass remained stable; (2) macrofaunal density scaled positively with rhodolith volume; (3) macroinvertebrate diversity showed contrasting relationships with rhodolith volume at SP15 (positive) and SP18 (negative); and (4) differences in macroinvertebrate assemblages between the two study sites and between spring and the other three seasons were mainly driven by variation in the density of up to the seven most abundant taxa.
4.1. Rhodolith Bed Structure
We showed that the rhodolith bed at both sites was structurally stable throughout the survey, containing >90% of live and dead rhodoliths and coarse biogenic sediments, as well as similar rhodolith densities (~822 individuals m−2) and biomasses (~11.5 kg rhodoliths m−2) in any given season. Such rhodolith densities and biomasses within the 15–20 m depth range (1) parallel the ~858 rhodoliths m−2 reported by Gagnon et al. [30] for a shallower (8 to 10 m deep) portion of the same bed sampled four years before the present study, and (2) are up to twice lower than the peak 19.5 kg rhodoliths m−2 measured in other portions of the bed within the 8–15 m depth range four years before [30] and four years after [50] the present study. That rhodolith biomass varies spatially within the bed despite a homogenous rhodolith density, indicates that rhodolith size varies across the bed. In a study of the growth response of L. glaciale rhodoliths to seasonal changes in sea temperature and light in the same bed, Bélanger and Gagnon [33] showed that rhodolith tissue growth did not vary within the 8–25 m depth range despite a 6× decrease in photosynthetically active radiation (PAR) with depth. Growth, therefore, is an unlikely driver of the uneven distribution of variably sized rhodoliths across the St. Philip’s bed. We propose that differences in habitat characteristics between both sites, including the greater abundance of larger and taller rocky outcrops surrounding SP18, may help create hydrodynamic conditions more favorable for rhodolith growth or long-term preservation of rhodolith size and shape, even during occasional, yet damaging wind and wave storms (see below).
The rhodolith bed framework differed between the two study sites, primarily because of a greater abundance of empty and disarticulated shells of horse mussels (Modiolus modiolus) at SP18 than at SP15. Live horse mussels in the rhodolith bed predominantly form clumps attached to bedrock outcrops, with shells often covered in thick and branching coralline crusts. The relatively tall and steep bedrock outcrops enclosing SP18 host larger populations of M. modiolus than those on the shorter and more dispersed outcrops surrounding SP15 (authors’ scuba observations). When they die, mussels, and their continuously expanding and thickening cover of coralline algae, presumably detach and fall down the outcrops, and water currents and mobile organisms move the empty shells across the bed. Such active and passive transportation and displacement of empty, disarticulated mussel shells, which would eventually become rhodoliths as new L. glaciale tissue develops and would accumulate over time, may well explain our observed 4x greater abundance of mussel-shell-nucleated rhodoliths at SP18 than at SP15.
The size and shape of the nuclei likely influenced the overall morphology of nucleated rhodoliths [38,70,71]. For example, shell-nucleated rhodoliths were predominantly large (≥50 cm3) with a bladed or elongated shape, characteristic of bivalve shells, whereas pebble nuclei were much smaller than shell nuclei, accordingly yielding 2.5x fewer large rhodoliths. We also showed that rhodolith shape distribution was similar among pebble-nucleated and non-nucleated rhodoliths, with ~70% of compact shapes, while shell-nucleated rhodoliths were mostly bladed (59%) or elongate (20%) but seldom compact. Our finding that the majority of rhodoliths at both study sites were nonetheless non-nucleated and compact in shape parallels observations in other sections of the St. Philip’s bed since 2012 [30,36,50]. Predominantly compact shapes have also been documented in arctic [72,73], temperate [71,74], and tropical [75,76] rhodolith beds. Compact shapes presumably result from uniform, radial rhodolith growth facilitated by occasional overturning by hydrodynamic forces [74,77] or bioturbators [36]. Nucleation type and bioturbation are likely the main drivers of rhodolith size and morphology in the St. Philip’s bed since hydrodynamic forces are generally insufficient to move rhodoliths [36].
Our noted differences in the rhodolith bed framework suggest mild seasonal reworking of the bed. Although invertebrates and fish can transport rhodoliths over distances of up to several meters per day [36,78,79], it is unlikely that bioturbation solely accounted for the 13% increase in rhodolith cover from winter to fall, and the 16% decrease in the abundance of compact rhodoliths from winter to summer. This is especially true of SP18, with the high bedrock outcrops that almost entirely enclosed the bed. Interestingly, a major wave storm swept our study sites during the first week of March 2013, (i.e., ~1 wk before the first rhodolith survey (winter)). Extraordinarily, strong surge and bottom currents completely ripped epibenthic enclosures while moving heavy (15 kg) cinder blocks over several meters across the bed we had installed several 10 s of meters away from SP15. This major disturbance pushed large quantities of rhodoliths into areas with lower hydrodynamic forces while exposing large patches of the sedimentary bottom normally overtopped by rhodoliths. Our casual observations of the rhodolith bed after the storm suggested sections of the rhodolith bed framework were gradually redistributing, presumably by the combined effects of water motion and bioturbation. Observed seasonal differences in rhodolith shape distribution were unexpected given that the slow growth rate of <1 mm y−1 in L. glaciale rhodoliths [32,33,34,35,80,81] is unlikely to yield perceptible changes in the shape of the majority of rhodoliths over the course of ~6 months. The marginally significant statistical differences of our post hoc comparisons suggested a mild seasonal effect on rhodolith shape distribution that may have been caused by the highly heterogeneous distribution of variably shaped rhodoliths across the bed.
Our findings, therefore, generally supported our hypothesis that the bed’s structure differs between sites, yet is temporally stable within each site. Accordingly, we conclude that the rhodolith bed framework, particularly in terms of rhodolith size and shape, varies spatially across the bed and that local stability prevails under the main influence of biological forcing until sporadic and unusually intense physical forcing reworks the framework.
4.2. Rhodolith Macrofauna
We showed that rhodolith macrofaunal richness in the St. Philip’s bed was >2 times higher than that reported for arctic L. glaciale beds [39,73]. Macrofaunal abundance, however, was dominated by a few species with brittle stars (Ophiopholis aculeata and Ophiura robusta) and chitons (Tonicella marmorea and Stenosemus albus), accounting for >50% of all the specimens identified, and ~70% of total macrofaunal biomass. Studies of other portions of the St. Philip’s bed carried out 4 y before [30], as well as 1 y [36] and 4 y [50] after the present study, also highlighted the dominance of these and other abundant taxa, including green sea urchin (Strongylocentrotus droebachiensis), common sea star (Asterias rubens), and wrinkled rock borer (Hiatella arctica), therefore highlighting high temporal stability in the main composition of the macrofaunal community. The present study’s finer taxonomic resolution unveiled the important contribution of gastropods (Puncturella noachina and Moelleria costulata) and polychaetes (Sabellidae and Terebellidae) to total macrofaunal abundance and diversity.
Unlike biomass, macrofaunal density scaled positively with rhodolith volume. Positive relationships between macrofaunal density and rhodolith size have been described in other rhodolith beds [82,83,84]. We found that most macrofauna was located within spaces between rhodolith branches, or deeper inside cavities running within the rhodoliths’ calcified skeleton, which explains why larger rhodoliths housed higher macrofaunal density than smaller ones. Brittle stars and sea urchins were among the largest organisms sampled, contributing mostly to total macrofaunal biomass. Large brittle stars often had their central disc recessed in between distal portions of rhodolith branches, with their arms extending into the water column to collect food particles. Sea urchins, with their rigid spherical test, were located mainly on the outer surface of rhodoliths, with a small proportion of tiny individuals concealed in between branches. The largely spheroidal shape of most rhodoliths sampled implies that the surface-to-volume ratio decreased nearly logarithmically with increasing rhodolith size. Accordingly, the amount of surface and space available at the periphery of rhodoliths, mainly occupied by larger brittles stars and sea urchins, increased at a lower rate than the internal space available for colonization by smaller macrofauna. This imbalance could explain the lack of a significant relationship between macrofaunal biomass and rhodolith volume.
Macrofaunal diversity (H) increased at SP15 but decreased at SP18, with increasing rhodolith volume. Positive relationships between macrofaunal diversity and rhodolith size were linked to higher heterogeneity of microhabitats associated with larger rhodoliths in other beds [83,84]. The majority of large (≥50 cm3) rhodoliths at SP15 were non-nucleated or had a small pebble nucleus that made only a small volume of space unavailable to macrofauna. In contrast, ~60% of the largest rhodoliths at SP18 had a horse mussel-shell nucleus, creating a considerable amount of inner, open space that could potentially be colonized by macrofauna. Our results, therefore, only partially supported our hypothesis that the abundance and diversity of rhodolith macrofauna scale positively with rhodolith size. We conclude that the relationship between rhodolith size and rhodolith macrofaunal abundance or diversity varies ontogenetically, being largely allometric in non-nucleated rhodoliths and isometric in rhodoliths with proportionally large nuclei.
Significant differences in macrofaunal biomass and diversity between SP15 and SP18 supported our hypothesis that rhodolith macrofauna differs between sites. Rhodolith volume was ~20% higher, and large (≥50 cm3) rhodoliths were ~20% less nucleated at SP15 than SP18, providing additional space and microhabitat to a more abundant and diverse macrofaunal assemblage. PERMANOVA and SIMPER analyses of macrofaunal data revealed that 87% of all the taxa sampled were common to both sites, with most of the between-site dissimilarity explained by the high abundances at SP15 of a few dominant taxa, including Ophiopholis aculeata, Tonicella marmorea, Hiatella arctica, Puncturella noachina, and sabellid polychaetes. NMDS analysis corroborated the above-noted considerable overlap in macrofauna between the two study sites. Our results, therefore, suggest that the bed in St. Philip’s is characterized by a relatively homogenous and biodiverse macrofaunal assemblage whose spatial variability is largely explained by differences in the distribution and abundance of a few numerically dominant taxa.
Our findings that macrofaunal density in spring was 25% higher than that in any of the three other seasons sampled, while macrofaunal biomass dropped by ~50 between winter and spring, attest to considerable temporal variability in the size structure of the macrofaunal community. Mass spawning in brittle stars is common in the northwest Atlantic [85,86]. Our observed 3× lower biomass-to-density ratio of brittle stars in spring compared to winter suggests that massive recruitment of juveniles occurred between the two seasons. Because brittle stars accounted for 36% and 64% of the total macrofaunal density and biomass, respectively, such major recruitment events could largely explain seasonal variability in the St. Philip’s bed. Nevertheless, we showed that over 75% of all taxa were present in all seasons, whereas the taxa that were not present in all seasons accounted for <1% of the total macrofaunal abundance. PERMANOVA, SIMPER, and NMDS analyses revealed that the higher densities of the up-to-seven most abundant taxa (Ophiura robusta, Ophiopholis aculeata, Tonicella marmorea, Stenosemus albus, Hiatella arctica, Punturella noachina, and sabellid polychaetes) in spring were responsible for 50–60% of the dissimilarity in macrofaunal assemblages between this and the three other seasons. Our results therefore strongly support our hypothesis that rhodolith macrofauna varies seasonally.
5. Conclusions
Our nine-month field survey of the St. Philip’s bed revealed that the rhodolith bed framework is spatially heterogeneous, yet provides a temporally stable habitat to an abundant and highly diverse (at least 108 taxa) macrofaunal assemblage dominated by a few taxa (including brittle stars, chitons, bivalves, gastropods, polychaetes, sea urchins, and sea stars). We showed that certain habitat components, such as bivalve shells, can have a profound effect on rhodolith morphology and associated macrofauna, with larger, non-nucleated rhodoliths generally hosting higher macrofaunal density, biomass, and diversity. Spatiotemporal variability in rhodolith macrofauna was mainly driven by seasonal fluctuations in the relative abundance of up-to-seven numerically dominant taxa, with little changes in otherwise homogenous species composition.
The present study, which was carried out at an unprecedentedly fine taxonomic resolution, strongly supports the notion that rhodolith beds are key biodiversity hotspots. Its spatial and temporal domains, also largely unparalleled for this kind of ecosystem, provide clear, quantitative evidence that rhodolith beds provide a stable framework under the main influence of biological forcing until sporadic and unusually intense physical forcing reworks it. These findings are worrisome in the face of observed and predicted changes in ocean climate because they suggest that rhodolith beds are particularly vulnerable to ongoing increases in the frequency and severity of wind and wave storms [87,88]. In other studies [33,35], we concluded that ongoing ocean warming will benefit subarctic L. glaciale rhodoliths by shortening the yearly period over which sea temperatures near 0 °C prevent growth. Further studies should address the resilience of rhodolith beds to wave storms and other types of physical or chemical forcing (e.g., ocean warming, acidification, and eutrophication) to better understand and predict the trajectory of rhodolith-based ecosystems.
Supplementary Materials
The following supporting information can be downloaded at: https://www.mdpi.com/article/10.3390/d15060774/s1, Table S1: Summary of permutational multivariate analysis of variance (PERMANOVA), based on Bray-Curtis dissimilarity for square-root transformed count data, examining the effect of the fixed factors Site (SP15 and SP18) and Season (winter, spring, summer, and fall) on (A) substratum type percent cover based on six categories: live rhodolith, dead rhodolith, sediment, shell, pebble, and cobble/boulder), (B) rhodolith shape distribution based on ten shape classes: compact, compact-platy, platy, very-platy, compact-bladed, bladed, very-bladed, compact-elongate, elongate, very-elongate, and (C) rhodolith macrofaunal community based on 52 taxa. All analyses were performed on balanced design using Type I sums of squares and a 5% significance level (α = 0.05).; Table S2: Summary of (A) negative binomial regression examining the effect of fixed factors Site (SP15 and SP18) and Season (winter, spring, summer, and fall) on rhodolith density, and for (B) and (C) binomial regressions examining the effect of the fixed factor Site (SP15 and SP18) on rhodolith nucleation (nucleated and non-nucleated) and nucleus type (pebble-nucleated and shell-nucleated), respectively. All analyses were performed on balanced design using Type I sums of squares and a 5% significance level (α = 0.05).; Table S3: Summary of two-way ANOVAs examining the effect of the fixed factors Site (SP15 and SP18) and Seasons (winter, spring, summer, and fall) on (A) rhodolith biomass, and (B) total rhodolith volume per 30 × 30-cm quadrat (0.09 m2). All analyses were performed on balanced design using Type I sums of squares and a 5% significance level (α = 0.05).; Table S4: Summary of negative binomial linear models (applied to non-transformed count data) examining the effect of the fixed factors Site (SP15 and SP18) and Season (winter, spring, summer, and fall), and covariate Volume (total rhodolith volume per 30 × 30-cm quadrat) on macrofaunal density. Analysis was performed on balanced design using Type I sums of squares and a 5% significance level (α = 0.05).; Table S5: Summary of ANCOVAs examining the effect of the fixed factors Site (SP15 and SP18) and Season (winter, spring, summer, and fall), and covariate Volume (total rhodolith volume per 30 × 30-cm quadrat) on macrofaunal biomass (wet weight). Analysis was performed using Type I sums of squares and a 5% significance level (α = 0.05).; Table S6: Summary of ANCOVAs examining the effect of the fixed factors Site (SP15 and SP18) and Season (winter, spring, summer, and fall), and covariate Volume (total rhodolith volume per 30 × 30-cm quadrat) on rhodolith macrofaunal community Shannon diversity index (H). Analysis was performed using Type I sums of squares and a 5% significance level (α = 0.05).; Table S7: Macrofauna taxa identified in the St. Philip’s rhodolith bed. Numbers indicate mean density (±SE) per 30 × 30-cm quadrat (0.09 m2) at the two study sites (SP15 and SP18; data pooled across seasons), and in each sampling season (data pooled across sites) (see Table 1 for collection dates). Zero (0) values indicate absence for a given collection. Crosses (x) indicate sponge taxa that were present but not tallied because of fragmentation. Polychaete species listed under family names were identified from subsamples but not tallied for quantitative analyses.; Table S8: Summary of SIMPER analysis for the substratum type assemblages. Dissim is the average (±SD) contribution of each species/Taxon to the overall dissimilarity between contrasted sites (SP15, SP18) or seasons. CumSum is the ordered cumulative contribution to overall dissimilarity. avgA and avgB are the average substratum type occurrence (square root transformed) for the first and second contrasted site/season, respectively.; Tale S9: Summary of SIMPER analysis for the rhodolith shape assemblages. Dissim is the average (±SD) contribution of each species/Taxon to the overall dissimilarity between contrasted sites (SP15, SP18) or seasons. CumSum is the ordered cumulative contribution to overall dissimilarity. avgA and avgB are the average substratum type occurrence (square root transformed) for the first and second contrasted site/season, respectively.; Table S10: Summary of SIMPER analysis for macrofaunal community. Dissim is the average (±SD) contribution of each species/taxon to the overall dissimilarity between contrasted sites (SP15, SP18) or seasons. CumSum is the ordered cumulative contribution to overall dissimilarity. avgA and avgB are the average species/taxon abundances (square root transformed) for the first and second contrasted site/season, respectively.
Author Contributions
Conceptualization, D.B. and P.G.; methodology, D.B. and P.G.; validation, D.B. and P.G.; formal analysis, D.B.; investigation, D.B. and P.G.; resources, P.G.; writing—original draft preparation, D.B. and P.G.; writing—review and editing, P.G.; visualization, D.B.; supervision, P.G.; project administration, P.G.; funding acquisition, P.G. All authors have read and agreed to the published version of the manuscript.
Funding
This research was funded by the Natural Sciences and Engineering Research Council (NSERC Discovery Grant, Grant number RGPIN-355875-2008), Canada Foundation for Innovation (CFI Leaders Opportunity Funds, Grant number 16940), Research and Development Corporation of Newfoundland and Labrador (Ignite R&D, Grant number 5003.070.002), and Department of Fisheries and Aquaculture of Newfoundland and Labrador (DFA, Grant number BS-48456) grants to P.G.; D.B. was supported by the Memorial University of Newfoundland President’s Doctoral Student Investment Fund Program.
Institutional Review Board Statement
Not applicable.
Data Availability Statement
The data presented in this study are available in the Supplementary Materials.
Acknowledgments
We are grateful to A. P. St-Pierre, D. Frey, and I. Lima for assistance with field and laboratory work, and Kent Gilkinson and Laure de Montety for help with the taxonomic identification of invertebrates. We also thank P. Snelgrove, R. Gregory, and two anonymous reviewers for constructive comments that helped improve the manuscript.
Conflicts of Interest
The authors declare no conflict of interest. The funders had no role in the design of the study; in the collection, analyses, or interpretation of data; in the writing of the manuscript; or in the decision to publish the results.
References
- McCoy, E.D.; Bell, S.S. Habitat structure: The evolution and diversification of a complex topic. In Habitat Structure; Springer: Dordrecht, The Netherlands, 1991; pp. 3–27. [Google Scholar]
- Byrne, L.B. Habitat Structure: A fundamental concept and framework for urban soil ecology. Urban Ecosyst. 2007, 10, 255–274. [Google Scholar] [CrossRef] [Green Version]
- de Camargo, N.F.; Sano, N.Y.; Vieira, E.M. Forest vertical complexity affects alpha and beta diversity of small mammals. J. Mammal. 2018, 99, 1444–1454. [Google Scholar] [CrossRef]
- Garden, J.G.; Mcalpine, C.A.; Possingham, H.P.; Jones, D.N. Habitat structure is more important than vegetation composition for local-level management of native terrestrial reptile and small mammal species living in urban remnants: A case study from Brisbane, Australia. Austral. Ecol. 2007, 32, 669–685. [Google Scholar] [CrossRef] [PubMed]
- Zimbres, B.; Peres, C.A.; Machado, R.B. Terrestrial mammal responses to habitat structure and quality of remnant riparian forests in an Amazonian cattle-ranching landscape. Biol. Conserv. 2017, 206, 283–292. [Google Scholar] [CrossRef] [Green Version]
- Beck, M.W. Comparison of the measurement and effects of habitat structure on gastropods in rocky intertidal and mangrove habitats. Mar. Ecol. Prog. Ser. 1998, 169, 165–178. [Google Scholar] [CrossRef]
- Buhl-Mortensen, L.; Buhl-Mortensen, P.; Dolan, M.F.J.; Dannheim, J.; Bellec, V.; Holte, B. Habitat complexity and bottom fauna composition at different scales on the continental shelf and slope of northern Norway. Hydrobiologia 2012, 685, 191–219. [Google Scholar] [CrossRef] [Green Version]
- Carvalho, L.R.S.; Loiola, M.; Barros, F. Manipulating habitat complexity to understand its influence on benthic macrofauna. J. Exp. Mar. Biol. Ecol. 2017, 489, 48–57. [Google Scholar] [CrossRef]
- Preston, F.W. Time and space and the variation of species. Ecology 1960, 41, 612–627. [Google Scholar] [CrossRef]
- MacArthur, R.H.; Wilson, E.O. (Eds.) The Theory of Island Biogeography; Princeton University Press: Princeton, NJ, USA, 1967. [Google Scholar]
- Connor, E.F.; McCoy, E.D. The statistics and biology of the species-area relationship. Am. Nat. 1979, 113, 791–833. [Google Scholar] [CrossRef]
- Dean, R.L.; Connell, J.H. Marine invertebrates in an algal succession. III. Mechanisms linking habitat complexity with diversity. J. Exp. Mar. Biol. Ecol. 1987, 109, 249–273. [Google Scholar] [CrossRef]
- Hixon, M.A.; Menge, B.A. Species diversity: Prey refuges modify the interactive effects of predation and competition. Theor. Popul. Biol. 1991, 39, 178–200. [Google Scholar] [CrossRef]
- Myhre, L.C.; Forsgren, E.; Amundsen, T. Effects of habitat complexity on mating behavior and mating success in a marine fish. Behav. Ecol. 2013, 24, 553–563. [Google Scholar] [CrossRef]
- Bell, S.S.; McCoy, E.D.; Mushinsky, H.R. (Eds.) Habitat Structure: The Physical Arrangement of Objects in Space; Population and Community Biology Series; Springer: Dordrecht, The Netherlands, 1991; Volume 8. [Google Scholar]
- Jones, C.G.; Lawton, J.H.; Shachak, M. Organisms as ecosystem engineers. Oikos 1994, 69, 373. [Google Scholar] [CrossRef]
- Buhl-Mortensen, L.; Vanreusel, A.; Gooday, A.J.; Levin, L.A.; Priede, I.G.; Buhl-Mortensen, P.; Gheerardyn, H.; King, N.J.; Raes, M. Biological structures as a source of habitat heterogeneity and biodiversity on the deep ocean margins. Mar. Ecol. 2010, 31, 21–50. [Google Scholar] [CrossRef]
- Coggan, N.V.; Hayward, M.W.; Gibb, H. A global database and “state of the field” review of research into ecosystem engineering by land animals. J. Anim. Ecol. 2018, 87, 974–994. [Google Scholar] [CrossRef] [PubMed]
- Curd, A.; Pernet, F.; Corporeau, C.; Delisle, L.; Firth, L.B.; Nunes, F.L.D.; Dubois, S.F. Connecting Organic to Mineral: How the physiological state of an ecosystem-engineer is linked to its habitat structure. Ecol. Indic. 2019, 98, 49–60. [Google Scholar] [CrossRef] [Green Version]
- Steneck, R.S.; Graham, M.H.; Bourque, B.J.; Corbett, D.; Erlandson, J.M.; Estes, J.A.; Tegner, M.J. Kelp forest ecosystems: Biodiversity, stability, resilience and future. Environ. Conserv. 2002, 29, 436–459. [Google Scholar] [CrossRef] [Green Version]
- Eriksson, B.K.; Rubach, A.; Hillebrand, H. Biotic habitat complexity controls species diversity and nutrient effects on net biomass production. Ecology 2006, 87, 246–254. [Google Scholar] [CrossRef] [Green Version]
- Hauser, A.; Attrill, M.J.; Cotton, P.A. Effects of habitat complexity on the diversity and abundance of macrofauna colonising artificial kelp holdfasts. Mar. Ecol. Prog. Ser. 2006, 325, 93–100. [Google Scholar] [CrossRef]
- Koivisto, M.E.; Westerbom, M. Habitat structure and complexity as determinants of biodiversity in blue mussel beds on sublittoral rocky shores. Mar. Biol. 2010, 157, 1463–1474. [Google Scholar] [CrossRef]
- Adey, W.H.; Macintyre, I.G. Crustose coralline algae: A re-evaluation in the geological sciences. Geol. Soc. Am. Bull. 1973, 84, 883–904. [Google Scholar] [CrossRef]
- Bosence, D.W. Description and Classification of Rhodoliths (Rhodoids, Rhodolites). In Coated Grains; Peryt, T.M., Ed.; Springer: Berlin/Heidelberg, Germany, 1983; pp. 217–224. [Google Scholar] [CrossRef]
- Foster, M.S. Rhodoliths: Between rocks and soft places. J. Phycol. 2001, 37, 659–667. [Google Scholar] [CrossRef]
- Bosence, D.W.J. Coralline Algal Reef Frameworks. J. Geol. Soc. 1983, 140, 365–376. [Google Scholar] [CrossRef]
- Nelson, W.A. Calcified macroalgae critical to coastal ecosystems and vulnerable to change: A review. Mar. Freshw. Res. 2009, 60, 787–801. [Google Scholar] [CrossRef]
- Woelkerling, W.J.; Irvine, L.M.; Harvey, A.S. Growth-forms in non-geniculate coralline red algae (Coralliinales, Rhodophyta). Aust. Syst. Bot. 1993, 6, 277–293. [Google Scholar] [CrossRef]
- Gagnon, P.; Matheson, K.; Stapleton, M. Variation in rhodolith morphology and biogenic potential of newly discovered rhodolith beds in Newfoundland and Labrador (Canada). Bot. Mar. 2012, 55, 85–99. [Google Scholar] [CrossRef]
- Frantz, B.R.; Kashgarian, M.; Coale, K.H.; Foster, M.S. Growth rate and potential climate record from a rhodolith using 14C accelerator mass spectrometry. Limnol. Oceanogr. 2000, 45, 1773–1777. [Google Scholar] [CrossRef]
- Teed, L.; Bélanger, D.; Gagnon, P.; Edinger, E. Calcium carbonate (CaCO3) production of a subpolar rhodolith bed: Methods of estimation, effect of bioturbators, and global comparisons. Estuar. Coast. Shelf Sci. 2020, 242, 106822. [Google Scholar] [CrossRef]
- Bélanger, D.; Gagnon, P. High growth resilience of subarctic rhodoliths (Lithothamnion glaciale) to ocean warming and chronic low irradiance. Mar. Ecol. Prog. Ser. 2021, 663, 77–97. [Google Scholar] [CrossRef]
- Bélanger, D.; Gagnon, P. Low growth resilience of subarctic rhodoliths (Lithothamnion glaciale) to coastal eutrophication. Mar. Ecol. Prog. Ser. 2020, 642, 117–132. [Google Scholar] [CrossRef]
- Arnold, C.L.; Bélanger, D.; Gagnon, P. Growth resilience of subarctic rhodoliths (Lithothamnion glaciale, Rhodophyta) to chronic low sea temperature and irradiance. J. Phycol. 2022, 58, 251–266. [Google Scholar] [CrossRef] [PubMed]
- Millar, K.R.; Gagnon, P. Mechanisms of stability of rhodolith beds: Sedimentological aspects. Mar. Ecol. Prog. Ser. 2018, 594, 65–83. [Google Scholar] [CrossRef] [Green Version]
- Freiwald, A.; Henrich, R. Reefal coralline algal build-ups within the Arctic Circle: Morphology and sedimentary dynamics under extreme environmental seasonality. Sedimentology 1994, 41, 963–984. [Google Scholar] [CrossRef]
- Ballantine, D.L.; Bowden-Kerby, A.; Aponte, N.E. Cruoriella rhodoliths from shallow-water back reef environments in La Parguera, Puerto Rico (Caribbean Sea). Coral Reefs 2000, 19, 75–81. [Google Scholar] [CrossRef]
- Teichert, S. Hollow rhodoliths increase svalbard’s shelf biodiversity. Sci. Rep. 2014, 4, 6972. [Google Scholar] [CrossRef] [Green Version]
- Hinojosa-Arango, G.; Riosmena-Rodríguez, R. Influence of rhodolith-forming species and growth-form on associated fauna of rhodolith beds in the central-west Gulf of California, México. Mar. Ecol. 2004, 25, 109–127. [Google Scholar] [CrossRef]
- Gabara, S.S.; Hamilton, S.L.; Edwards, M.S.; Steller, D.L. Rhodolith structural loss decreases abundance, diversity, and stability of benthic communities at Santa Catalina Island, CA. Mar. Ecol. Prog. Ser. 2018, 595, 71–88. [Google Scholar] [CrossRef] [Green Version]
- Bracchi, V.A.; Meroni, A.N.; Epis, V.; Basso, D. Mollusk thanatocoenoses unravel the diversity of heterogeneous rhodolith beds (Italy, Tyrrhenian Sea). Diversity 2023, 15, 526. [Google Scholar] [CrossRef]
- Kamenos, N.A.; Moore, P.G.; Hall-Spencer, J.M. Attachment of the juvenile queen scallop (Aequipecten opercularis (L.)) to maerl in mesocosm conditions; juvenile habitat selection. J. Exp. Mar. Biol. Ecol. 2004, 306, 139–155. [Google Scholar] [CrossRef]
- Steller, D.L.; Cáceres-Martínez, C. Coralline algal rhodoliths enhance larval settlement and early growth of the Pacific calico scallop Argopecten ventricosus. Mar. Ecol. Prog. Ser. 2009, 396, 49–60. [Google Scholar] [CrossRef] [Green Version]
- Pearce, C.M.; Scheibling, R.E. Induction of metamorphosis of larvae of the green sea urchin, Strongylocentrotus droebachiensis, by coralline red algae. Biol. Bull. 1990, 179, 304–311. [Google Scholar] [CrossRef] [PubMed]
- Heyward, A.J.; Negri, A.P. Natural inducers for coral larval metamorphosis. Coral Reefs 1999, 18, 273–279. [Google Scholar] [CrossRef]
- Whalan, S.; Webster, N.S.; Negri, A.P. Crustose coralline algae and a cnidarian neuropeptide trigger larval settlement in two coral reef sponges. PLoS ONE 2012, 7, e30386. [Google Scholar] [CrossRef] [PubMed] [Green Version]
- Adey, W.H. Distribution of saxicolous crustose corallines in the northwestern North Atlantic. J. Phycol. 1966, 2, 49–54. [Google Scholar] [CrossRef]
- Adey, W.H.; Hayek, L.-A.C. Elucidating marine biogeography with macrophytes: Quantitative analysis of the North Atlantic supports the thermogeographic model and demonstrates a distinct subarctic region in the northwestern Atlantic. Northeast. Nat. 2011, 18, 1–128. [Google Scholar] [CrossRef]
- Hacker Teper, S.; Parrish, C.C.; Gagnon, P. Multiple trophic tracer analyses of subarctic rhodolith (Lithothamnion glaciale) bed trophodynamics uncover bottom-up forcing and benthic-pelagic coupling. Front. Mar. Sci. 2022, 9, 1–20. [Google Scholar] [CrossRef]
- Basso, D. Deep rhodolith distribution in the Pontian Islands, Italy: A model for the paleoecology of a temperate sea. Palaeogeogr. Palaeoclimatol. Palaeoecol. 1998, 137, 173–187. [Google Scholar] [CrossRef]
- Wentworth, C.K. A scale of grade and class terms for clastic sediments. J. Geol. 1922, 30, 377–392. [Google Scholar] [CrossRef]
- Graham, D.J.; Midgley, N.G. Graphical representation of particle shape using triangular diagrams: And excel spreadsheet method. Earth Surf. Proc. Land. 2000, 25, 1473–1477. [Google Scholar] [CrossRef]
- Sneed, E.D.; Folk, R.L. Pebbles in the lower Colorado River, Texas a study in particle morphogenesis. J. Geol. 1958, 66, 114–150. [Google Scholar] [CrossRef]
- Abbott, R.T. American Seashells; the Marine Mollusca of the Atlantic and Pacific Coasts of North America, 2nd ed.; Van Nostrand Reinhold: New York, NY, USA, 1974; ISBN 0442202288. [Google Scholar]
- Pettibone, M.H. Marine Polychaete Worms of the New England Region: I. Families Aphroditidae through Trochocaetidae; Bulletin of the United States National Museum: Washington, DC, USA, 1963; pp. 1–356. [Google Scholar]
- Fauchald, K. The Polychaete Worms. Definitions and Keys to the Orders, Families and Genera; Science Series; Natural History Museum of Los Angeles County: Los Angeles, CA, USA, 1977; Volume 28, pp. 1–188. [Google Scholar]
- Appy, T.D.; Linkletter, L.E.; Dadswell, M.J. Annelida: Polychaeta: A Guide to the Marine Flora and Fauna of the Bay of Fundy; Canada Fisheries and Marine Service Technical Report; Government of Canada: St. Andrews, NB, Canada, 1980; p. 920. [Google Scholar]
- Pocklington, P. Polychaetes of Eastern Canada: An Illustrated Key to Polychaetes of Eastern Canada including the Eastern Arctic; Scientific Monograph Funded by Ocean Dumping Control Act Research Fund; National Museums of Canada & Department of Fisheries and Oceans: Mont-Joli, QC, Canada, 1989. [Google Scholar]
- Gosner, K.L. Atlantic Seashore: A Field Guide to Sponges, Jellyfish, Sea Urchins, and More; Houghton Mifflin Harcourt: Boston, MA, USA, 2014; ISBN 0544530853. [Google Scholar]
- Pollock, L.W. A Practical Guide to the Marine Animals of Northeastern North America; Rutgers University Press: New Brunswick, MA, USA, 1998; ISBN 0813523990. [Google Scholar]
- Abbott, R.T.; Morris, P.A. Shells of the Atlantic and Gulf Coasts and the West Indies, 4th ed.; Houghton Mifflin Harcourt: Boston, MA, USA, 2001; ISBN 0442202288. [Google Scholar]
- Squires, H.J. Decapod Crustacea of the Atlantic Coast of Canada (Canadian Bulletin Fisheries Aquatic Sciences); Department of Fisheries and Oceans Canada: Ottawa, ON, Canada, 1990; Volume 221. [Google Scholar]
- Anderson, M.J. A new method for non-parametric multivariate analysis of variance. Austral Ecol. 2001, 26, 32–46. [Google Scholar] [CrossRef]
- Quinn, G.P.; Keough, M.J. Experimental Design and Data Analysis for Biologists; Cambridge University Press: New York, NY, USA, 2002; ISBN 0521009766. [Google Scholar]
- Snedecor, G.; Cochran, W. Statistical Methods, 8th ed.; Iowa State University Press: Ames, IA, USA, 1994; ISBN 978-0-813-81561-9. [Google Scholar]
- R Core Team. R: A Language and Environment for Statistical Computing; R Foundation for Statistical Computing: Vienna, Austria, 2021; Available online: https://www.r-project.org/ (accessed on 14 February 2022).
- Venables, W.N.; Ripley, B.D. Modern Applied Statistics with S, 4th ed.; Springer: New York, NY, USA, 2002; ISBN 0-387-95457-0. Available online: https://www.stats.ox.ac.uk/pub/MASS4/ (accessed on 25 December 2022).
- Oksanen, J.; Simpson, G.; Blanchet, F.G.; Kindt, R.; Legendre, P.; Minchin, P.; O’hara, R.; Solymos, P.; Stevens, M.; Szoecs, E.; et al. Vegan: Community Ecology Package, Version 2.6-4. 2022. Available online: https://CRAN.R-project.org/package=vegan (accessed on 1 January 2023).
- Piller, W.E.; Rasser, M. Rhodolith formation induced by reef erosion in the Red Sea, Egypt. Coral Reefs 1996, 15, 191–198. [Google Scholar] [CrossRef]
- Del Río, J.; Ramos, D.A.; Sánchez-Tocino, L.; Peñas, J.; Braga, J.C. The Punta de La Mona rhodolith bed: Shallow-water Mediterranean rhodoliths (Almuñecar, Granada, southern Spain). Front. Earth Sci. 2022, 10, 884685. [Google Scholar] [CrossRef]
- Teichert, S.; Woelkerling, W.; Rüggeberg, A.; Wisshak, M.; Piepenburg, D.; Meyerhöfer, M.; Form, A.; Freiwald, A. Arctic rhodolith beds and their environmental controls (Spitsbergen, Norway). Facies 2014, 60, 15–37. [Google Scholar] [CrossRef]
- Teichert, S.; Woelkerling, W.; Rüggeberg, A.; Wisshak, M.; Piepenburg, D.; Meyerhöfer, M.; Form, A.; Büdenbender, J.; Freiwald, A. Rhodolith beds (Corallinales, Rhodophyta) and their physical and biological environment at 80 ° 31′ N in Nordkappbukta (Nordaustlandet, Svalbard Archipelago, Norway). Phycologia 2012, 51, 371–390. [Google Scholar] [CrossRef]
- Basso, D.; Nalin, R.; Nelson, C.S. Shallow-water Sporolithon rhodoliths from North Island (New Zealand). Palaios 2009, 24, 92–103. [Google Scholar] [CrossRef]
- Bahia, R.G.; Abrantes, D.P.; Brasileiro, P.S.; Pereira Filho, G.H.; Amado Filho, G.M. Rhodolith bed structure along a depth gradient on the northern coast of Bahia state, Brazil. Braz. J. Oceanogr. 2010, 58, 323–337. [Google Scholar] [CrossRef]
- Amado-Filho, G.M.; Maneveldt, G.; Manso, R.C.C.; Marins-Rosa, B.V.; Pacheco, M.R.; Guimarães, S. Structure of rhodolith beds from 4 to 55 meters deep along the southern coast of Espírito Santo State, Brazil. Cienc. Mar. 2007, 33, 399–410. [Google Scholar] [CrossRef] [Green Version]
- Marrack, E.C. The relationship between water motion and living rhodolith beds in the southwestern Gulf of California, Mexico. Palaios 1999, 14, 159–171. [Google Scholar] [CrossRef]
- James, D.W. Diet, movement, and covering behavior of the sea urchin Toxopneustes roseus in rhodolith beds in the Gulf of California, México. Mar. Biol. 2000, 137, 913–923. [Google Scholar] [CrossRef]
- Pereira-Filho, G.H.; Veras, P.C.; Francini-Filho, R.B.; Moura, R.L.; Pinheiro, H.T.; Gibran, F.Z.; Matheus, Z.; Neves, L.M.; Amado-Filho, G.M. Effects of the sand tilefish Malacanthus plumieri on the structure and dynamics of a rhodolith bed in the Fernando de Noronha Archipelago, tropical West Atlantic. Mar. Ecol. Prog. Ser. 2015, 541, 65–73. [Google Scholar] [CrossRef]
- Kamenos, N.A.; Law, A. Temperature controls on coralline algal skeletal growth. J. Phycol. 2010, 46, 331–335. [Google Scholar] [CrossRef]
- Halfar, J.; Zack, T.; Kronz, A.; Zachos, J.C. Growth and high-resolution paleoenvironmental signals of rhodoliths (coralline red algae): A new biogenic archive. J. Geophys. Res. Oceans 2000, 105, 22107–22116. [Google Scholar] [CrossRef]
- Steller, D.L.; Riosmena-Rodríguez, R.; Foster, M.S.; Roberts, C.A. Rhodolith bed diversity in the Gulf of California: The importance of rhodolith structure and consequences of disturbance. Aquat. Conserv. 2003, 13, S5–S20. [Google Scholar] [CrossRef]
- Veras, P.C.; Pierozzi, I., Jr.; Lino, J.B.; Amado-Filho, G.M.; Senna, A.R.; Santos, C.S.G.; de Moura, R.L.; Passos, F.D.; Giglio, V.J.; Pereira-Filho, G.H. Drivers of biodiversity associated with rhodolith beds from euphotic and mesophotic zones: Insights for management and conservation. Perspec. Ecol. Conserv. 2020, 18, 37–43. [Google Scholar] [CrossRef]
- Foster, M.S.; McConnico, L.M.; Lundsten, L.; Wadsworth, T.; Kimball, T.; Brooks, L.B.; Medina-López, M.; Riosmena-Rodríguez, R.; Hernández-Carmona, G.; Vásquez-Elizondo, R.M. Diversity and natural history of a Lithothamnion muelleri-Sargassum horridum community in the Gulf of California. Cienc. Mar. 2007, 33, 367–384. [Google Scholar] [CrossRef] [Green Version]
- Himmelman, J.H.; Dumont, C.P.; Gaymer, C.F.; Vallières, C.; Drolet, D. Spawning synchrony and aggregative behaviour of cold-water echinoderms during multi-species mass spawnings. Mar. Ecol. Prog. Ser. 2008, 361, 161–168. [Google Scholar] [CrossRef]
- Doyle, G.M.; Hamel, J.F.; Mercier, A. Small-scale spatial distribution and oogenetic synchrony in brittlestars (Echinodermata: Ophiuroidea). Estuar. Coast. Shelf Sci. 2014, 136, 172–178. [Google Scholar] [CrossRef]
- Guo, L.; Perrie, W.; Long, Z.; Toulany, B.; Sheng, J. The impacts of climate change on the autumn North Atlantic wave climate. Atmos. Ocean 2015, 53, 491–509. [Google Scholar] [CrossRef]
- Working Group II. Climate Change 2022: Impacts, Adaptation and Vulnerability; IPCC Sixth Assessment Report; IPCC: Geneva, Switzerland, 2022. [Google Scholar]
Figure 1.
(A) Location of the present study’s focal Lithothamnion glaciale rhodolith bed (star), off the town of St. Philip’s in Conception Bay, Newfoundland (eastern Canada). (B) Portion of the rhodolith bed at site SP18 showing lithic boulders (LB) and one of the bedrock outcrops colonized by live horse mussels (HM, Modiololus modiolus). (C) Close-up view of the rhodolith bed surface showing live and dead rhodoliths; lithic pebbles (LP); disarticulated horse mussel shells (DS), biogenic sands (BS), and loose seaweed (LS) fragments. (D) Disarticulated horse mussel shells at early (top) and advanced (bottom) stages of coralline algal encrustation. (E) Non-nucleated praline rhodoliths (top) and large (~12 cm across), partially broken/eroded mussel-shell (white arrow) nucleated boxwork rhodolith (bottom).

Figure 2.
Variation in mean (A) surface cover (±95% CI) of substratum types, and (B) proportion of rhodolith shapes, between the two study sites (SP15 and SP18) and among the four sampling seasons. PERMANOVA analyses showed no Site–Season interaction for substratum type or rhodolith shape (see Table S1 in Supplement S1), and hence data were pooled across seasons (n = 12 and 36 per site for substratum types and rhodolith shapes, respectively) and across sites (n = 6 and 18 per season for substratum types and rhodolith shapes, respectively). Error bars are 95% CIs. Sites (seasons) not sharing the same lowercase (uppercase) letters differ statistically at a significance level of 5% (solid lines) or 10% (dashed lines). Cobble/boulder surface cover was ≤1% at both sites and in all seasons, and hence is not shown in (A) for simplicity (see Section 3.1).

Figure 3.
Relative abundance of (A) rhodoliths per 5 cm3 size class intervals at the two study sites. Relative abundances were calculated using all rhodoliths collected during the four seasonal surveys at SP15 (n = 2849) and SP18 (n = 2805); (B) nucleated rhodoliths and main nucleus type at the two study sites (n = 36 for each site, error bars = 95% CI). Bars with different letters differ statistically (p < 0.05); and (C) each of four rhodolith shape categories for non-nucleated (n = 4371), pebble-nucleated (n = 383), and shell-nucleated (n = 538) rhodoliths (data were pooled across sites (SP15 and SP18) and seasons (winter, spring, summer, and fall)).

Figure 4.
Ternary diagrams showing the distribution of rhodoliths among the ten shape classes (compact (C), compact–platy (CP), compact–bladed (CB), compact–elongate (CE), platy (P), bladed (B), elongate (E), very platy (VP), very bladed (VB), very elongate (VE)) as defined by Sneed and Folk [54] associated with the spheroidal, discoidal, and ellipsoidal rhodolith morphologies at (A) site SP15 (n = 2489) and (B) site SP18 (n = 2802), and for (C) pebble-nucleated rhodoliths (n = 383), and (D) shell-nucleated rhodoliths (n = 538). Rhodoliths at SP15 and SP18 were pooled across seasons (winter, spring, summer, and fall). Pebble- and shell-nucleated rhodoliths were pooled across sites and seasons.

Figure 5.
Mean macrofaunal (A) density, (B) biomass, and (C) diversity at the two study sites (left panels) and within each season (right panels) (n = 36 each). Regression lines indicate significant relationships between (A) macrofaunal density (negative binomial regression applied to macrofaunal counts) or (B) diversity (linear regression applied to Shannon diversity index) and rhodolith volume. Errors are 95% confidence intervals (±95% CIs). Bars not sharing the same letters differ statistically (p < 0.05).

Figure 6.
Non-metric multidimensional scaling (NMDS) using Bray–Curtis dissimilarity for macrofaunal counts showing dissimilarity of macrofaunal assemblages (53 taxa) between (A) the two study sites (SP15 and SP18), and (B) the four sampling seasons (n = 72 for each). Smaller and larger solid dots indicate individual sample and group (site or season) centroids, respectively.


Table 1.
Schedule of video transects acquisition and rhodolith collections at the two study sites (SP15 and SP18). Temperature is the sea temperature averaged from hourly recordings at the surface of the rhodolith bed at SP15 over a 2-week period encompassing the sampling dates listed for both sites.
| Survey | Site | Sampling Date (2013) | Temperature °C (±SD) |
|---|---|---|---|
| Winter | SP15 | 14 Mar | −0.1 (0.2) |
| SP18 | 4 Mar | ||
| Spring | SP15 | 17 Jun | 5.5 (1.9) |
| SP18 | 10 Jun | ||
| Summer | SP15 | 17 Sep | 11.7 (1.5) |
| SP18 | 1 Oct | ||
| Fall | SP15 and SP18 | 15 Dec | 4.4 (0.6) |
Disclaimer/Publisher’s Note: The statements, opinions and data contained in all publications are solely those of the individual author(s) and contributor(s) and not of MDPI and/or the editor(s). MDPI and/or the editor(s) disclaim responsibility for any injury to people or property resulting from any ideas, methods, instructions or products referred to in the content. |
© 2023 by the authors. Licensee MDPI, Basel, Switzerland. This article is an open access article distributed under the terms and conditions of the Creative Commons Attribution (CC BY) license (https://creativecommons.org/licenses/by/4.0/).
Share and Cite
MDPI and ACS Style
Bélanger, D.; Gagnon, P. Spatiotemporal Variability in Subarctic Lithothamnion glaciale Rhodolith Bed Structural Complexity and Macrofaunal Diversity. Diversity 2023, 15, 774. https://doi.org/10.3390/d15060774
AMA Style
Bélanger D, Gagnon P. Spatiotemporal Variability in Subarctic Lithothamnion glaciale Rhodolith Bed Structural Complexity and Macrofaunal Diversity. Diversity. 2023; 15(6):774. https://doi.org/10.3390/d15060774
Chicago/Turabian StyleBélanger, David, and Patrick Gagnon. 2023. "Spatiotemporal Variability in Subarctic Lithothamnion glaciale Rhodolith Bed Structural Complexity and Macrofaunal Diversity" Diversity 15, no. 6: 774. https://doi.org/10.3390/d15060774
Note that from the first issue of 2016, this journal uses article numbers instead of page numbers. See further details here.