
Passive, Low-Energy Design and Green Star Strategy for Green Star-Rated Buildings in South Africa

Electrical, Electronic and Computer Engineering, University of KwaZulu-Natal, Durban 4041, South Africa
*
Author to whom correspondence should be addressed.
Energies 2022, 15(23), 9128; https://doi.org/10.3390/en15239128
Submission received: 3 October 2022
/
Revised: 4 November 2022
/
Accepted: 27 November 2022
/
Published: 1 December 2022
(This article belongs to the Special Issue Smart Buildings for a Sustainable Future)
Abstract
:Services surrounding green buildings are specialised and directed towards the process of design and comprise comprehensive and quantified management in its entirety. Implicitly, consultancies are unable to deliver this service at the standard and pace required in the preliminary stages of design, and not all clients or consultants will require the services to be essential. The main aim is to stabilise the several characteristics prompting one another to optimise design performance against the optimisation algorithms. Green Star is a universal evaluation tool, assessing not only green characteristics but also elements that influence wellbeing and occupant health, such as indoor environment quality. The tools for Green Star rating can be used to measure the green features of a building from the design phase right to the stage of site handover (known as “As-Built”). This paper refers, in the literature review, to the passive and low-energy design methods of a Green Star-rated building at early design stages. The “green” project management of a project is to coordinate multidisciplinary incorporation and to accompany the costing contribution tools presented in this paper. The passive and low-energy design tools discussed entails the amalgamation of electrical and mechanical services together with architecture, i.e., space layout and envelope design. This paper compares rationalised energy and indoor environment performance between two buildings against the activities and climatic conditions within a targeted Green Star-rated building. Proposals regarding 4- and 6-star ratings and techniques have been evaluated and presented for the two buildings.
1. Introduction
Energy efficiency is a mandatory requirement and an integral part of green and sustainable buildings [1,2]. Energy-efficient design optimization is both a design philosophy and a practical technique that has been proposed and used by various professional disciplines, i.e., architects and engineers [1,3,4]. The theory of sustainable, feasible and green buildings in construction is extensive, but it is largely disregarded in terms of the building structure/construction process [1]. The lifecycle begins at the inception and design stage, proceeding all the way through (i.e., operation, refurbishment, and maintenance of the building) to deconstruction [1,2]. A similar definition as per the Green Building Council of South Africa (GBCSA) recognizes that the design, construction, and operational practices for green building are integrated, which considerably decreases or eradicates the adverse effect of advancement on the environment and the people. Green buildings are understood to be resource and energy efficient, as well as environmentally responsible [2,3].
Overall, the biggest influence on life cycle resolutions prompting green buildings is prepared at the inception stage all the way to the design development stage of a building. Essentially, it is imperative that a buildings’ design employs optimization algorithms and principles of best practices to imitate appropriate sustainability norms and/or standards of achieving energy conservation/efficiency [1,2]. The methods provide for an optimized building energy operation that allows a reduction in primary energy requirements for HVAC, lighting, room-electricity, and auxiliary supply [2,5]. Similarly, consideration is given to take into green building rating tools, green building codes of practice and standards of energy efficiency.
Energy-efficient technologies are classified into several categories, i.e., passive, and low-energy design, building services, active systems and operation design [4]. Primarily, energy demand minimization and energy-efficient management are achieved by implementing the design technologies. As such, smart building concepts and controls are reviewed in the literature for sustainable operations [6,7,8,9,10,11]. These technologies target wellbeing, occupant health and indoor environment quality [3].
Presently, international practice acknowledges and encourages a “Deep Path” agenda of transformational adjustment in enabling 80% of a global decline in thermal energy demand from buildings by the year 2050 [3,11]. Significantly this comprises the following [3]:
- Net zero energy buildings (nZEB);
- Building energy codes being more stringent and compliant;
- Existing buildings to be retrofitted;
- Energy performance disclosure being mandatory;
- Renewables integration.
The annual emissions from new buildings constructed will be far less than that of existing buildings by the year 2050. This can be obtained by introducing and endorsing energy-efficient requirements for a building [3,4]. Energy and water efficiency are improved through retrofitting in existing buildings, which is the main attention around the world. Conversely, these buildings that are retrofitted are complex and is vital to avert potential lock-in to ineffective retrofits as shown through international knowledge with long-term drawbacks [11,12]. The necessity for complying with retrofits than to investigate ineffective retrofits is necessary as researched by international knowledge [12].
Sustainable structures are from a class of green buildings and are primarily related to the sustainable eco-friendly elements. This is closely connected with sustainable buildings and on-site works, whereas the wider concerns of linking sustainable elements and cost-effective design concepts with sustainable buildings are at large [13,14]. Thus, the Department of Public Works (DoPW) Green Building Policy focuses predominantly on the eco-friendly sustainable mechanisms of green buildings, and not the wider public and commercial issues [12,13].
Internationally and within South Africa, there are many role players that have an impact on green buildings. Two of the significant members within the South African context are discussed below:
- DoPW: As the curator of all fixed assets consigned in the national government, which are not entrusted in the custodianship of other departments through regulation, DoPW is the implementing agent with regards to buildings that are green in the private and public divisions for providing governance and practice [15,16];
- Department of Energy (DE): As the curator of the National Energy Efficiency Strategy (NEES), the Department (as well as the SANEDI) has a vital role in prompting efficient energy strategies in buildings in SA. Fundamentally, the Department’s and SANEDI’s function is to further explore efficient energy strategies in buildings via its co-operation for greening, among others [17,18].
2. Literature Review
The South African National Standard on Energy Efficiency in Buildings (SANS 204:2011) aligns principles for a plan of energy production by the type of building, while SANS 10400-XA gives the specialized necessities that structures must meet, so as to conform to the sections linked to energy in terms of National Building Regulations (NBR) [16,19,20,21]. While SANS 10400-XA is a huge advancement towards developing norms of a building, the particulars characterized made a great breakthrough in the construction industry. Presently, the Council for Scientific and Industrial Research (CSIR) and Construction Industry Development Board (CIDB) are creating building principles that will be progressively fixed by guidelines [16,20,21].
The tasks sequencing problem in construction is far more complicated than in other disciplines [22,23] (i.e., production processes). It is caused by the uniqueness of each construction project (in terms of technology, location, size, availability of resources, end use) [16,18,24]. Hence, mathematical, and heuristic methods do not allow for finding solutions of complicated construction problems in acceptable time [16]. For the same reasons’ metaheuristic algorithms seem to be the most appropriate measures for scheduling and task sequencing [25].
Widely analyzed metaheuristic methods include: Particle Swarm Optimization (PSO), Ant Colony Optimization (ACO), Genetic Algorithms (GA), Simulated Annealing (SA), and Tabu Search (TS). These algorithms do not guarantee finding the optimal solution of the given problem and their results are subject to input parameters. However, they are very useful when it comes to solving complex problems, as they allow for finding suboptimal solutions in acceptable time [26].
Prior to considering methods for optimization of structures, the basics of the structural design process should be mentioned. Such process usually follows the same progression as any other design task. The design process of building structures may be complicated due to its interdisciplinary character in making use of optimization techniques. The input from various stakeholders, may lead to large number of revisions or even to revisiting earlier design phases [1,25,26].
The building norms presented for new structures is a positive advancement, due to the simplicity of usage and commitment from investment funds. Despite the norms not being viewed as extraordinary to current practice, the expectation is for these guidelines to turn out to be progressively severe [27] for new structures in time [28,29]. The Department of Energy’s main concern will be to motivate for the development of buildings, by encouraging energy-efficient technology markets and not just focusing efforts on the buildings’ materials [26,27].
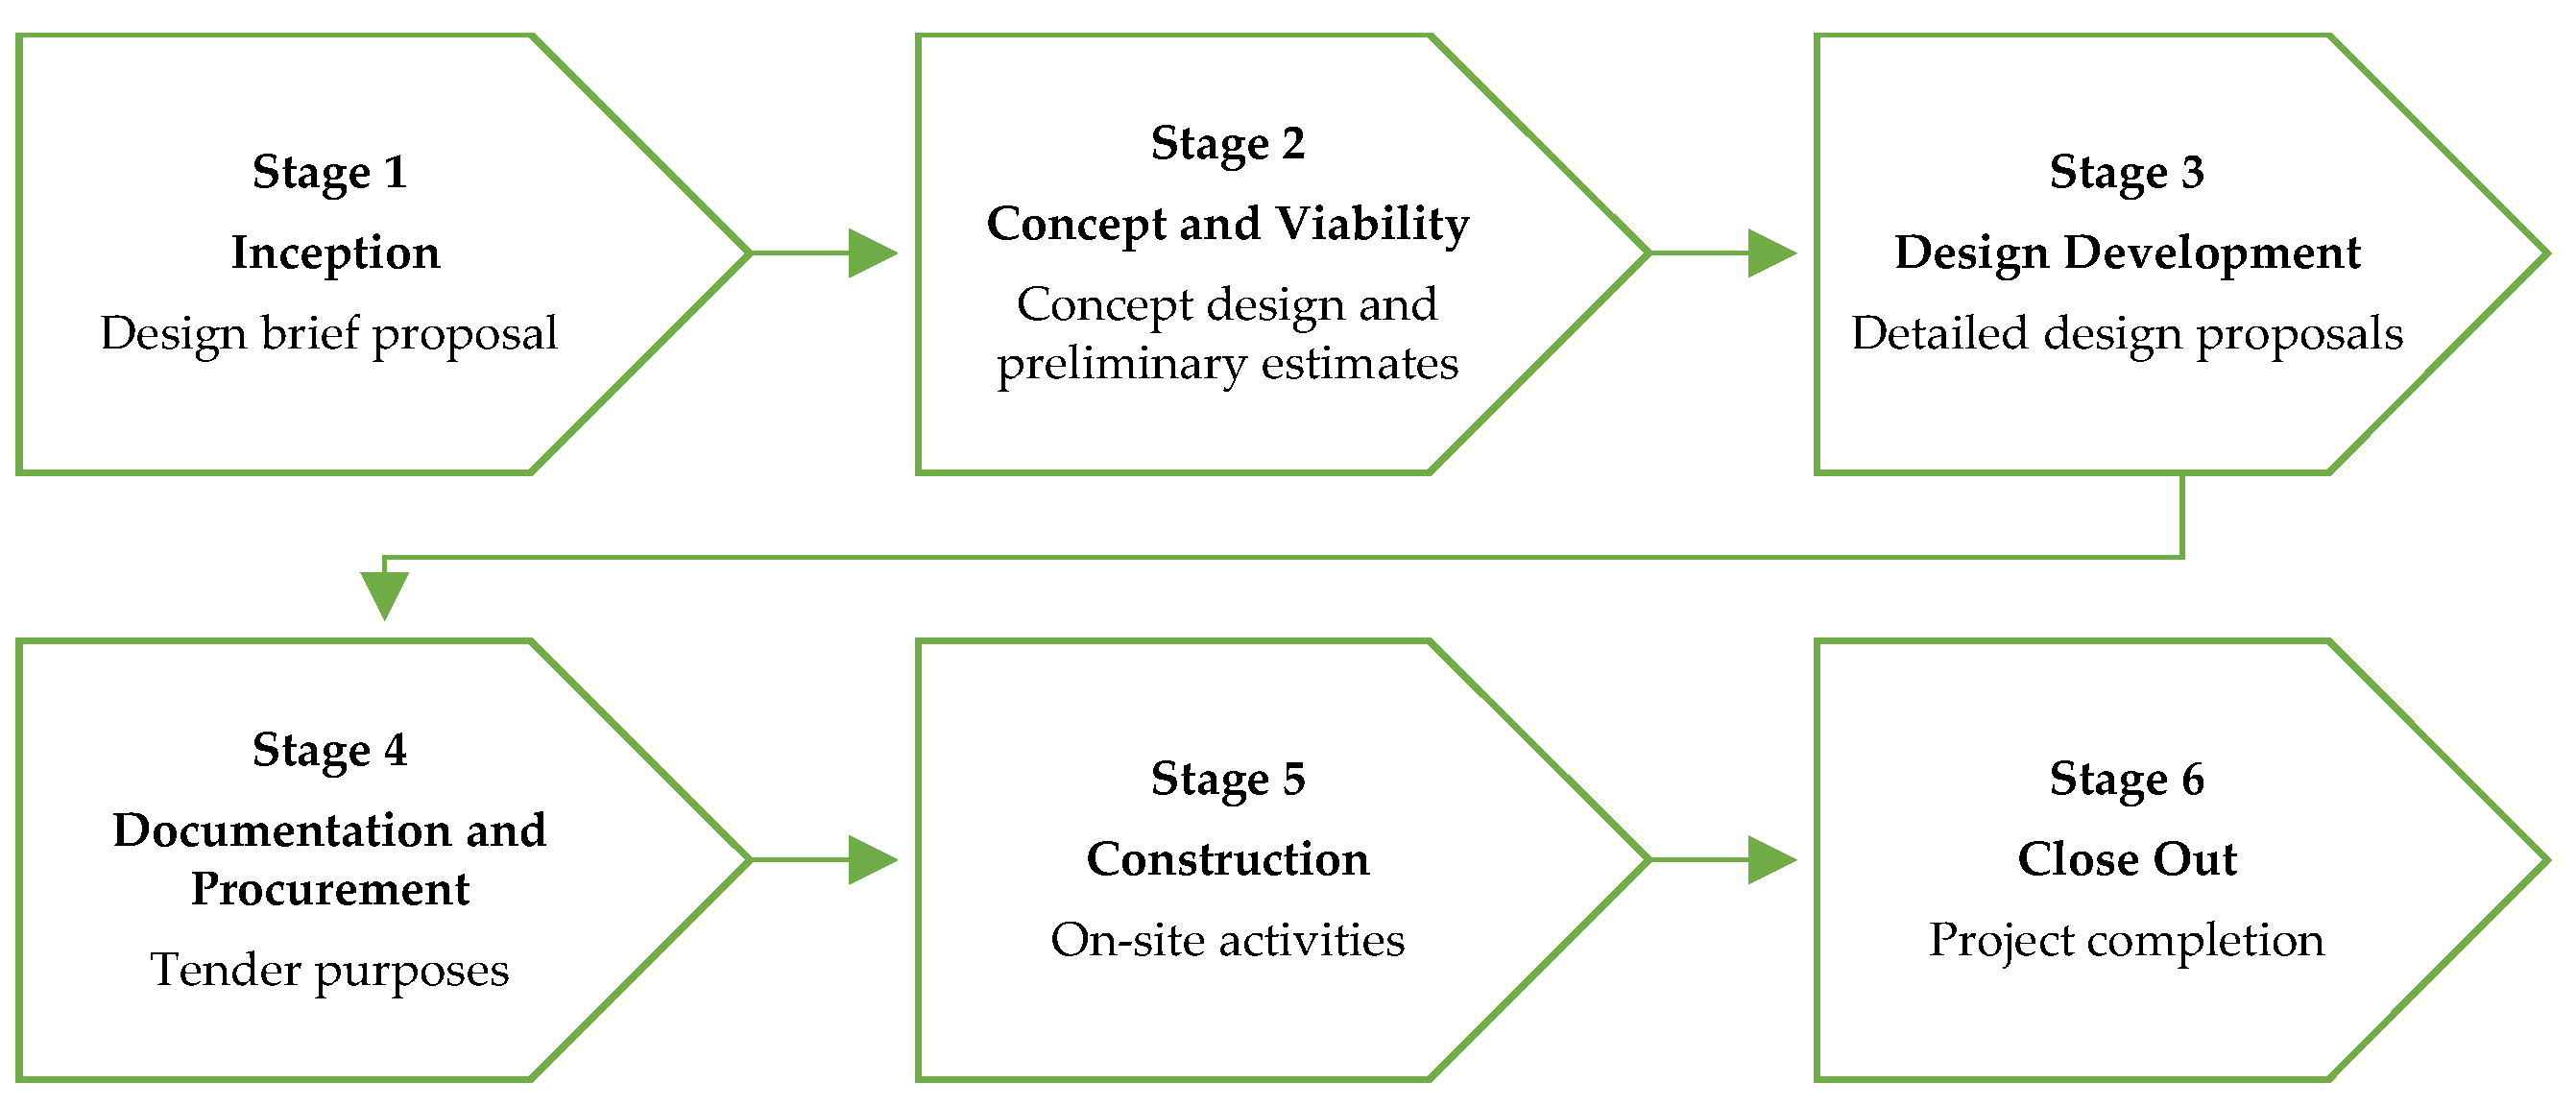
In its conventional form, the overall building design process consists of the following stages, as depicted in Figure 1 [2,29,30]:
- The inception stage—focuses on the design brief proposal from the client;
- The concept and viability stage—creation of initial concepts meeting broad design requirements (such as functionality) set by clients or architects and its preliminary estimates;
- The design development stage—further development of conceptual designs (one or more). Preparation of detailed proposals for tender purposes;
- The documentation and procurement stage—development of all information required for construction (sufficient for coordination of its components and elements);
- The construction stage—the detailed construction planning as executed by the contractor and appointed sub-contractors;
- The close out stage—final completion and handover of building to the end user.
Detailed information is available as we move through the design process, so the space for possible solutions narrows and thus easier to search by optimization algorithms [31]. The sooner the optimization process is started, the greater the range of possible solutions and the greater the possibility of cost reduction (or improvement of other parameters) [32,33].
The most basic boundary to expanding energy efficiency in the public sector is retrofitting the existing buildings [28,29]. The accentuation of the methods projected is consequently on distinguishing measures through which public structures can be renovated, with restricted financing from the public sector in utilizing innovative financing mechanisms.
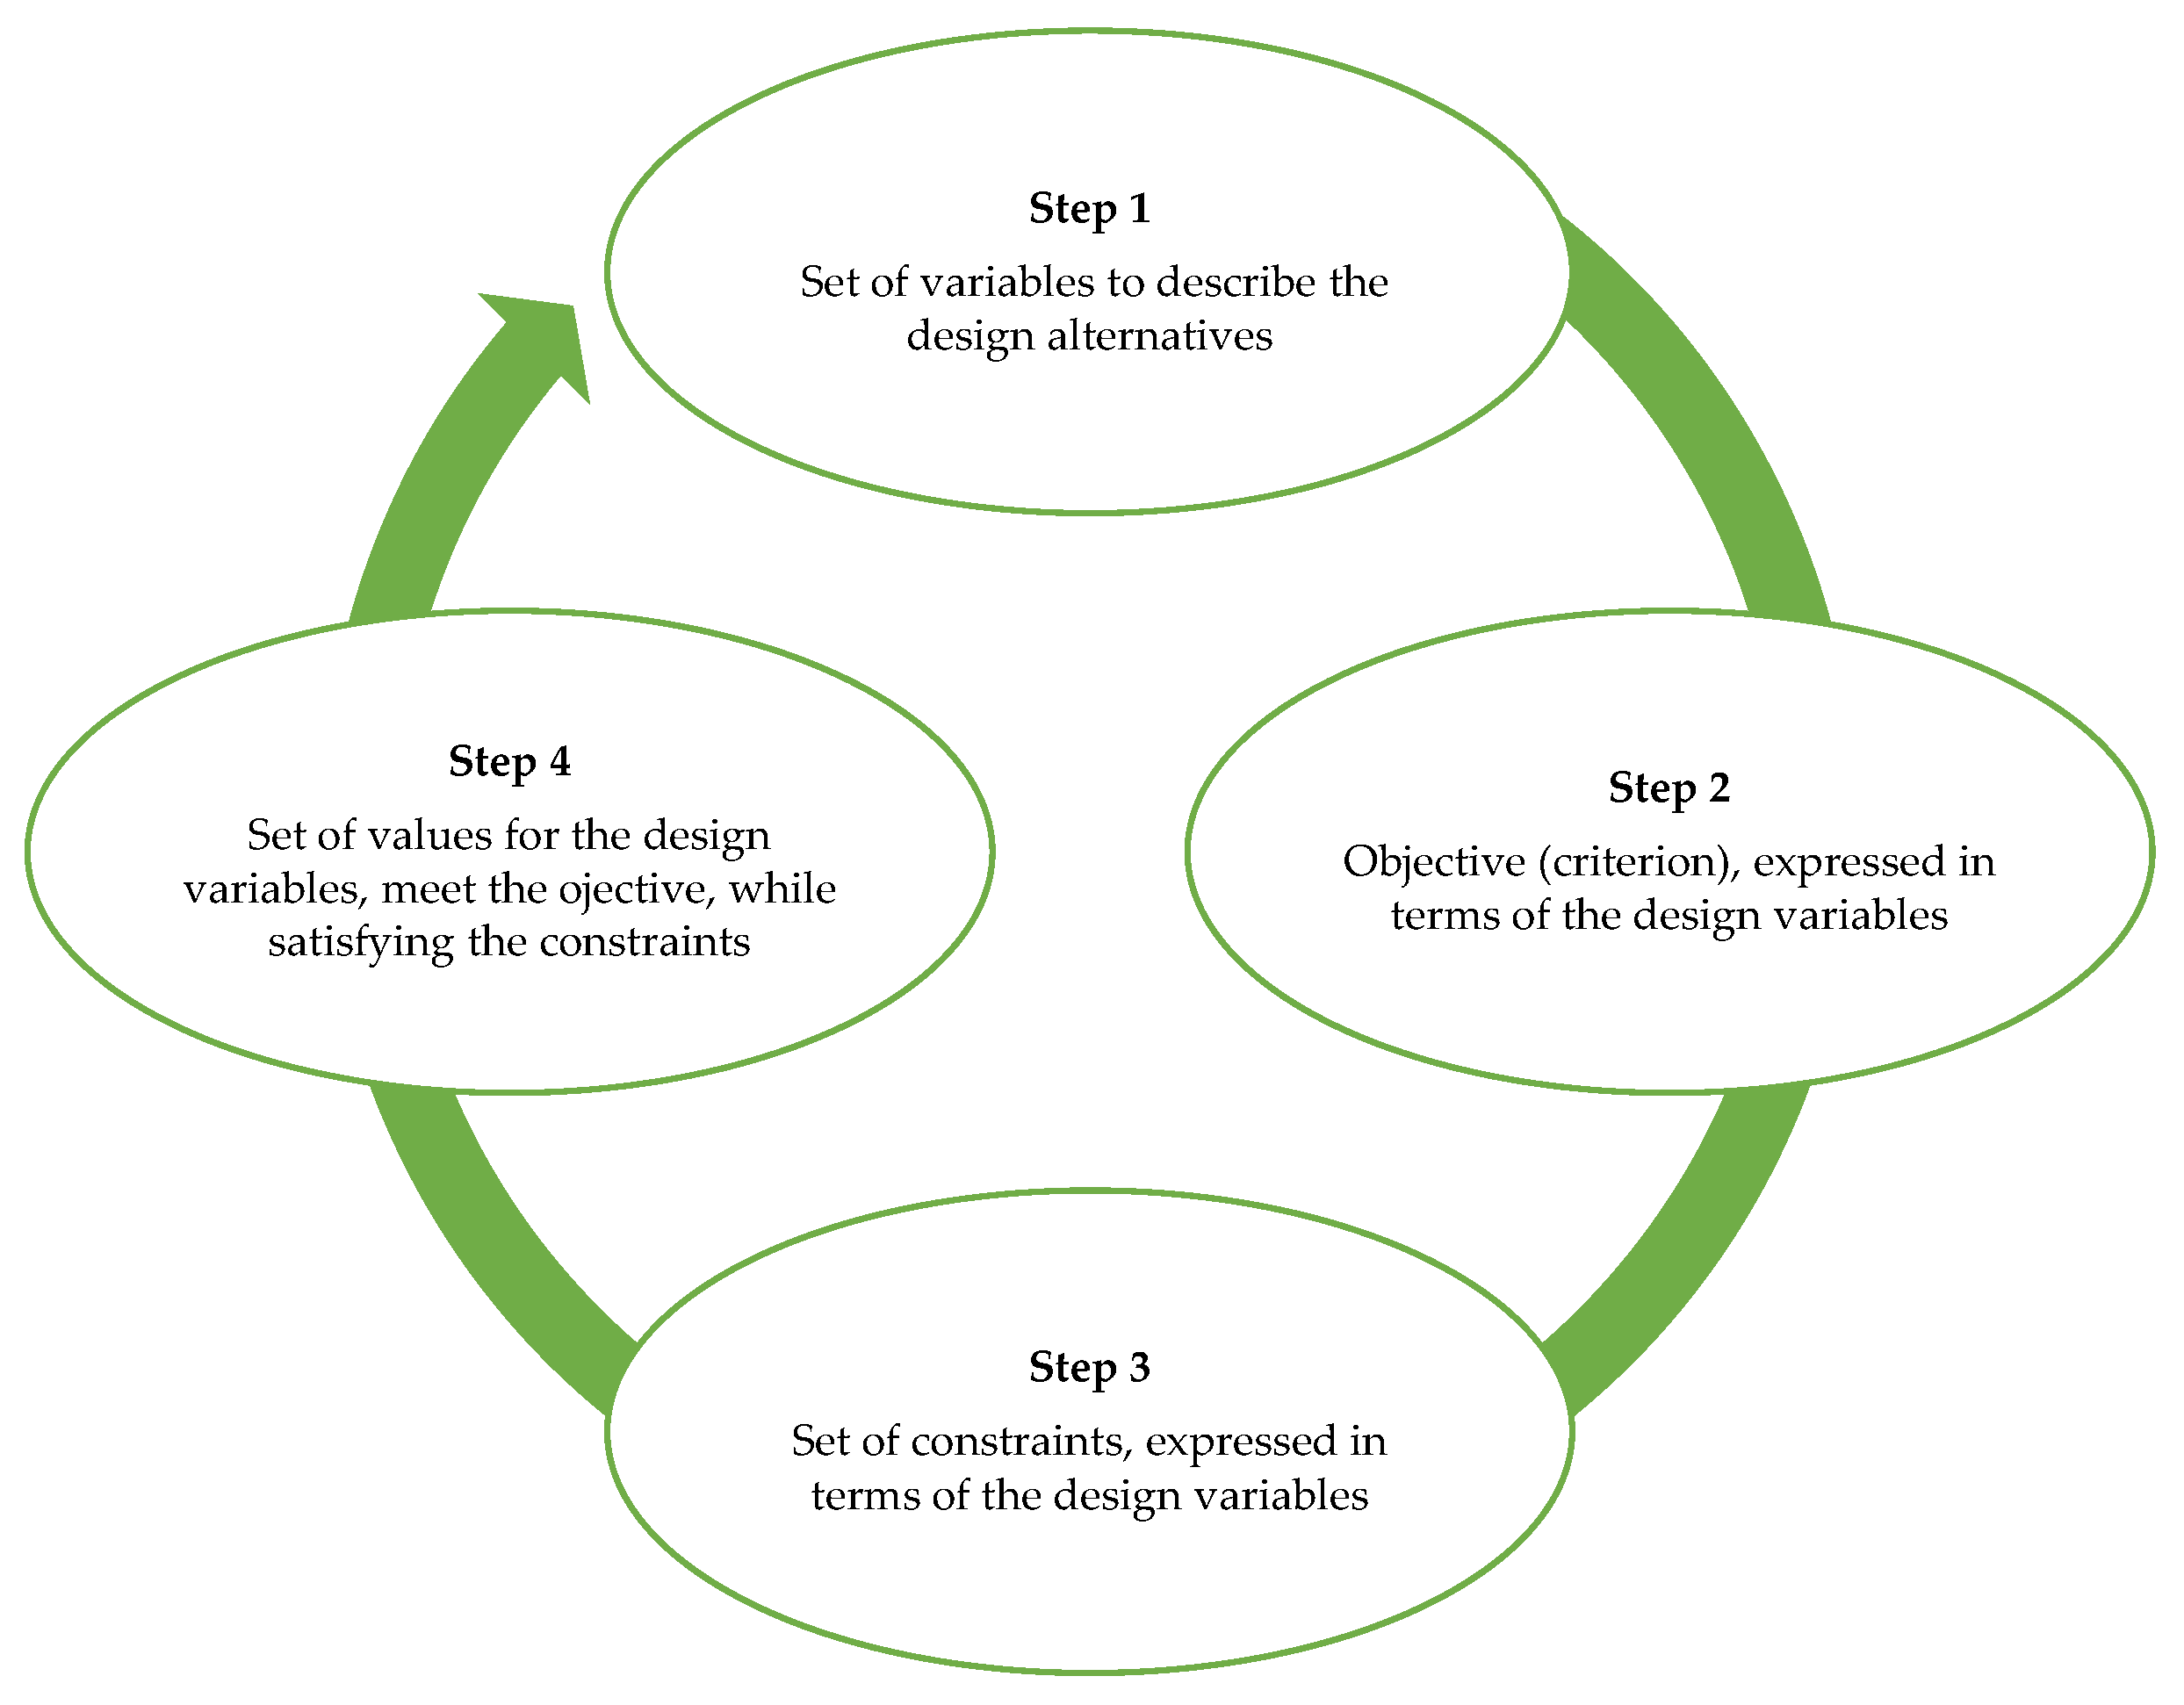
Within the overall building design process, engineering design optimization is loosely defined as the selection of the best design within the available means. The process involves four steps, as illustrated in Figure 2 [11]:
- Set of variables to be selected to describe the design alternatives;
- An objective (criterion), expressed in terms of the design variables, which we seek to increase or decrease;
- Set of constraints to be determined, expressed in terms of the design variables, which must be satisfied by any acceptable design;
- Set of values for the design variables, which minimize (or maximize) the objective, while satisfying all the constraints.
Passive design for any building includes infrastructure, architecture and devices that achieve a result by directly using natural forces/ambient energy [34] without conversion such as, e.g., passive/free ventilation, night cooling, shading technology, daylighting [35,36]. The aim of passive strategies is to make the best use of natural resources and adjust the building design. The design requests to establish the overall energy strategy of the development incorporating not only the building services (electricity consumption), but the aspects of the design that have a direct impact on those services. These include for the thermal performance of the envelope, solar control, and natural lighting [37,38,39].
In optimizing the energy performance of the building through design, the consumption is minimized while still ensuring the quality of comfort, ventilation, and lighting. Suitable passive, active or hybrid systems is defined to serve the different zones and performance requirements of the building. The optimizing process is quantitative using computer simulations to help evaluate the different strategies under consideration. Conventional engineers are appointed to carry out the detail design and documentation of the building systems [40,41,42].
Passive and low-energy design elements are embodied in the Green Star tools. The Green Star tool is broken down into nine categories, with each category containing several sustainability initiatives known as “credits”. Each credit has several pathways to achieve the intent or aim, and points are allocated to each pathway [28]. The total number of points in each category in Table 1 has a weighting applied related to the importance or relevance to the South African environment. The points required to achieve Green Star ratings are as follows [28]:
- 4 Stars: 45–59 points
- 5 Stars: 60–74 points
- 6 Stars: 75+ points
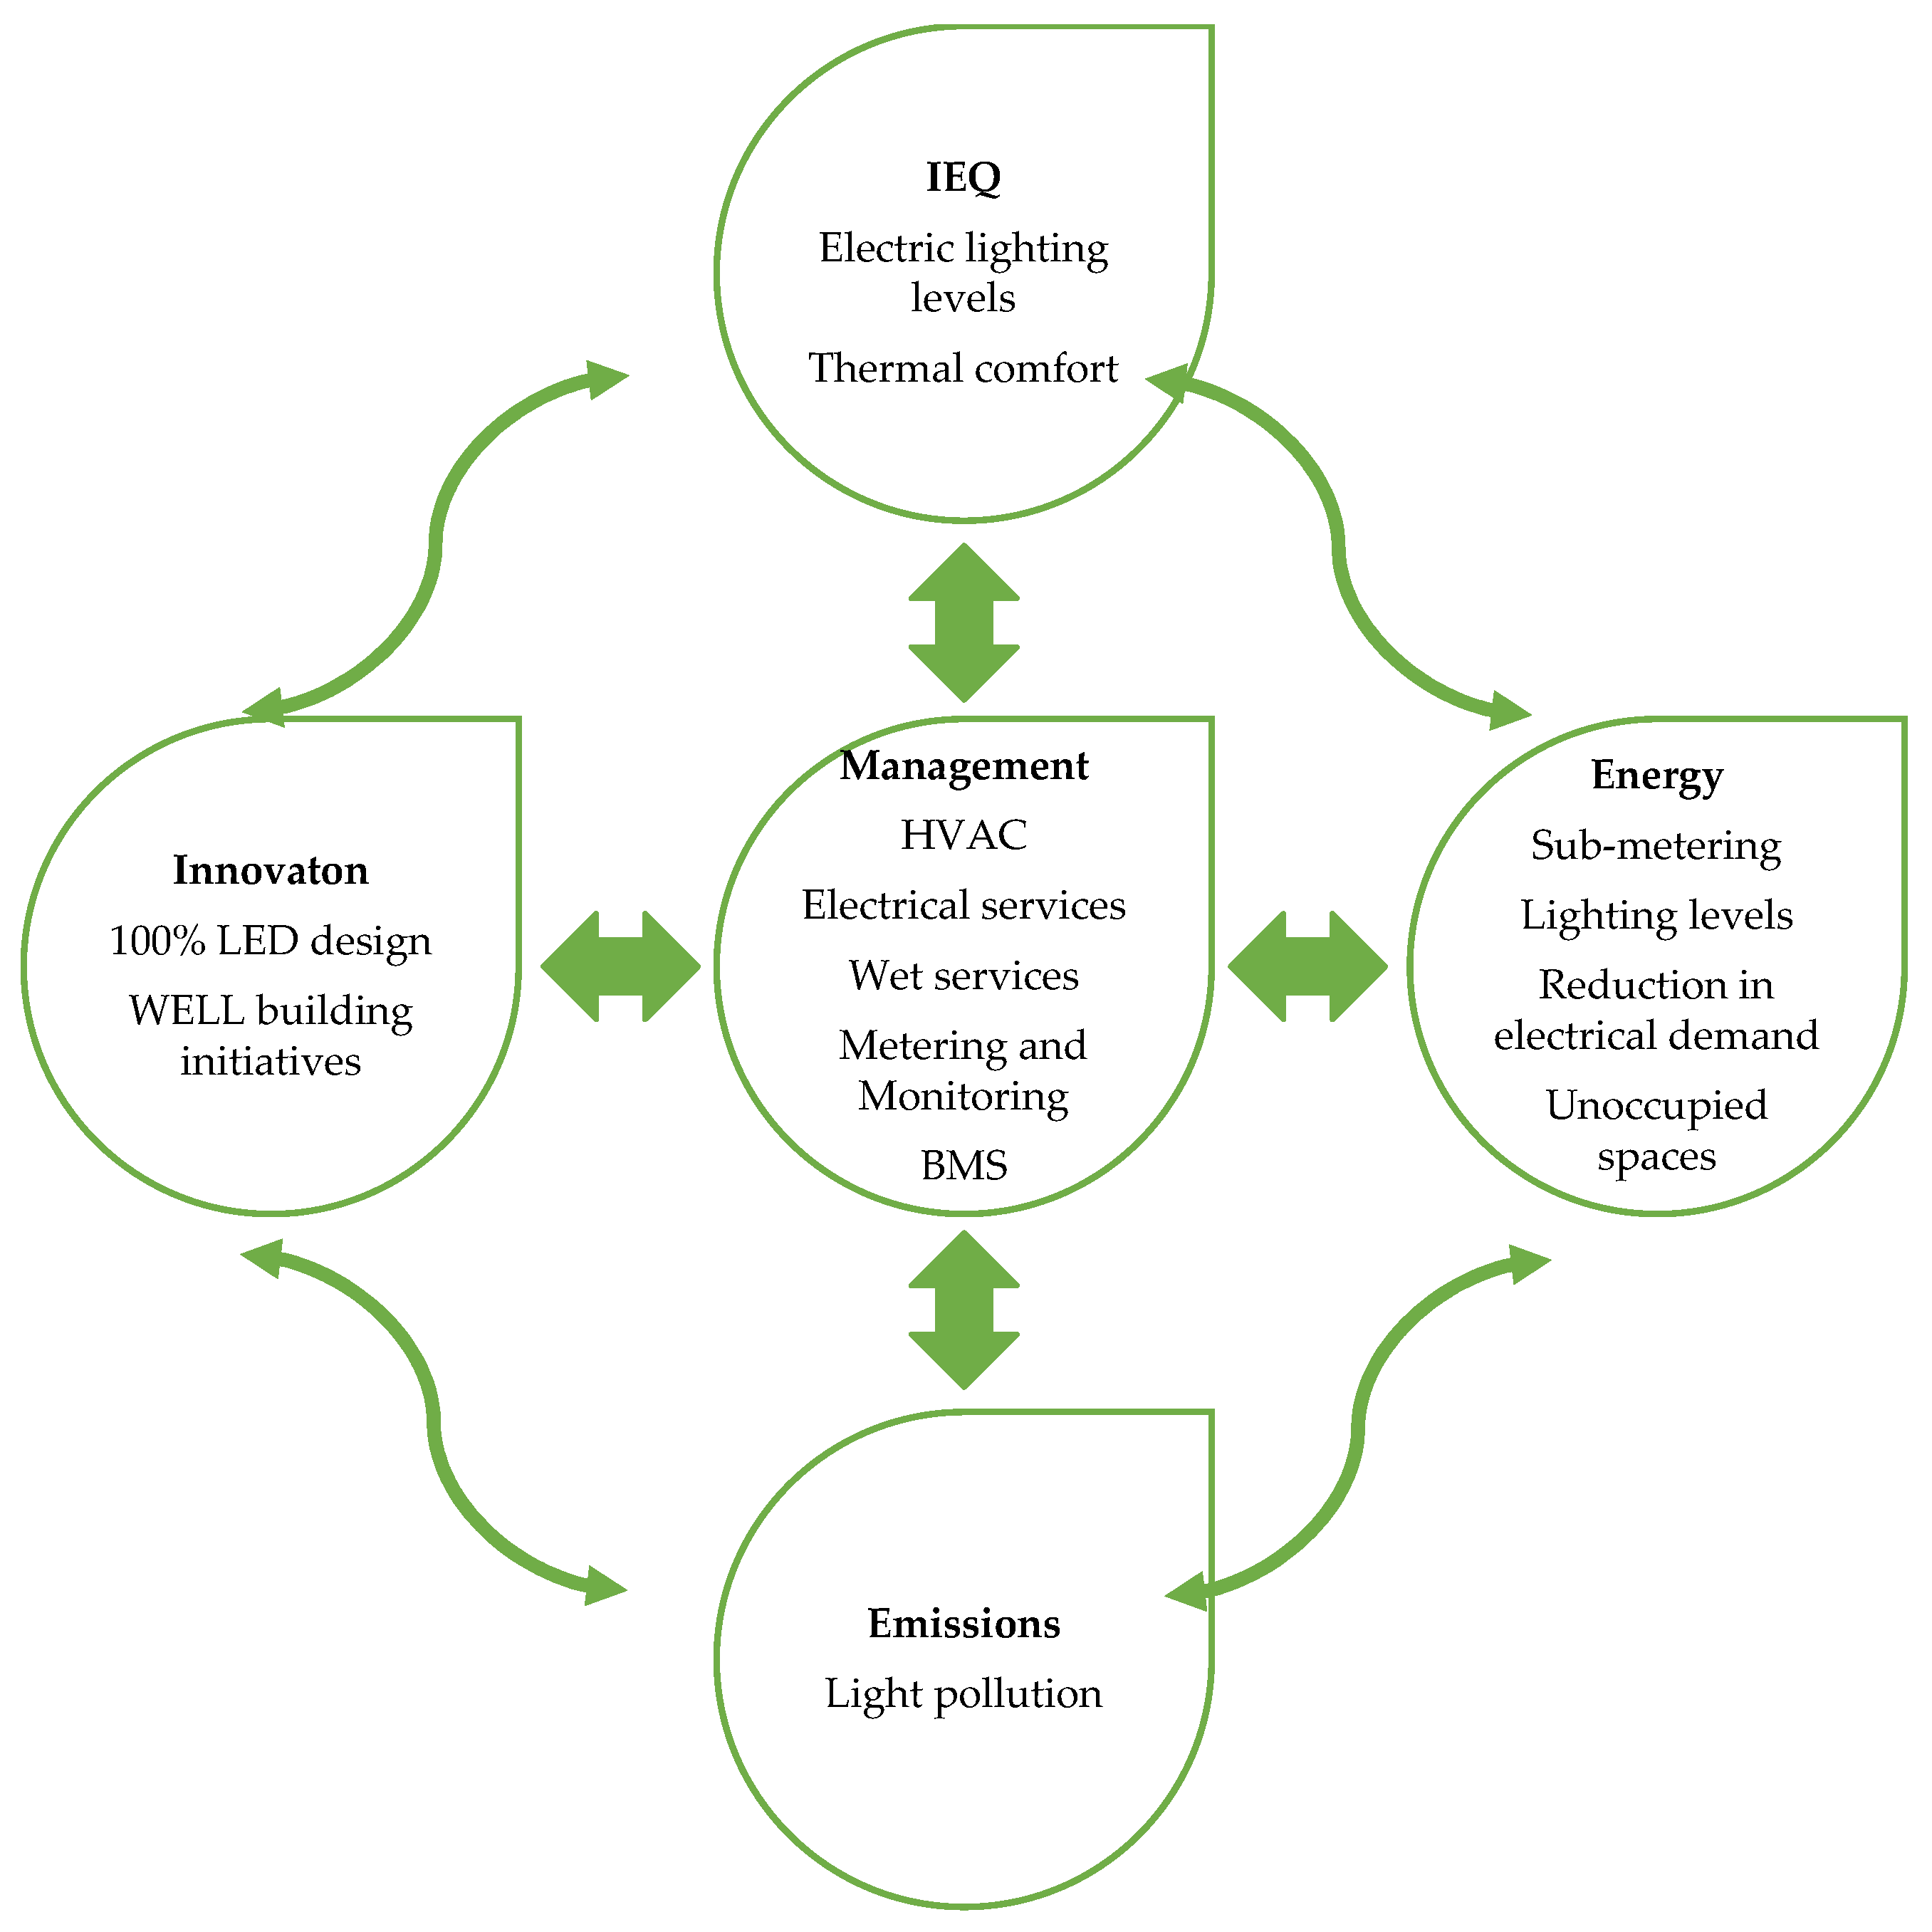
The nine categories defining the Green Star tools are: Management, Indoor Environmental Quality, Energy, Transport, Water, Materials, Land Use and Ecology, Emissions, and Innovation. The main categories this paper will highlight is Management, Indoor Environmental Quality, Energy, Emissions, and Innovation, which are pertinent to the Electrical Engineering discipline [28,29,43].
Figure 3 shows these categories in a form of an interconnected diagram, which have a dynamic relationship with each other (broader dynamic relationship with the concept design). At the heart lies the management category and four main interrelating categories, i.e., Energy, Indoor Environment Quality, Emissions, and Innovation. This framework in its embedded nature provides the platform/basis for which a simulation model can be theoretically built that recognizes the theoretical potential. In theory, this is what can be done. The recognition of the interconnectivity of the categories is where the gap is. The possibility of putting forward a simulation model by taking the interconnectedness is at large. Simulation of the interplay between the five categories can be modeled as a learning tool. A boundary is recognized around the five categories. The other four categories are influential, but not dealt with it and other significant factors.
Surrounding the certification level, three major factors, which are used in every green building rating system are environmental categories of evaluation: energy savings, water efficiency, and materials and resources. These three factors are also connected to the sustainability of the building, which also affects the level of certification [41,43]. Indoor air quality is another important environmental category used in green building rating systems and it is laid at the top connected to energy savings and of course it directly affects user experience of a building [41].
The certification available for these tools is split into various categories, i.e., 4, 5, and 6 stars, as follows [28]:
- 4 Stars: “Best Practice”;
- 5 Stars: “South African Excellence”;
- 6 Stars: “World Leadership”.
- Registration of the project with GBCSA;
- Collate and submit for round 1;
- GBCSA assessment and feedback;
- Collate and submit for round 2;
- Project Green Star certified.
The main energy strategies for a building are established during the early stages of the design concept in order to affect the biggest impact on the cost. It is proposed that these strategies be refined and elements of the building that influence these strategies be rationalized/optimized with regards to energy, comfort performance, and life cycle cost (LCC). The American Society of Heating, Refrigerating, and Air-Conditioning Engineers (ASHRAE) has established a policy exponentially improving the ASHRAE A90.1 Energy Standard for Buildings except Low-Rise Residential Buildings and ASHRAE 189 Standard for the Design of High-Performance in Figure 5 [44,45,46].
3. Passive and Low-Energy Design Methodology
The method of utilizing natural energy sources, such as wind and sun directly facilitate the system of a passive design, whereas low-energy design makes use its electric power and its facilities. This paper is confined to achieving energy conservation through the green design techniques that have been proposed, i.e., passive, and low-energy design. Green techniques that are inappropriate for analysis and irrelevant to energy conservation has been excluded in the discussion of Green Star rating buildings.
The focus in this paper is to assess the low and passive technologies. Analyzed passive technologies are electrical/mechanical installations as the basis for reducing the energy demand. A key role for the minimization of the energy demand are the building orientation and external fixings. Furthermore, the optimal utilization of daylight through daylighting control and the effect of natural ventilation strategies on the cooling demand are assessed.
In this paper, the analysis of two buildings, i.e., The EMS College for Emergency Care and The Nurses Residence have been part of study for passive and low-energy design. The EMS College of Emergency Care will utilize the Green Star Public and Education (PEB) tool. This is designed specifically for public, community and educational projects. The EMS College of Emergency Care will target both a 6-star design and a 6-star As-Built rating. The selected categories and proposed initiatives for this paper is discussed pertaining to an electrical design, but not rejecting the other disciplines. The Nurses Residence will adopt the Multi-Unit Residential v1 rating tool. This is relevant to innovative multi-unit residential facilities, with additions and extensive restorations of present multi-unit residential facilities of two units or more. This is adopted provided the Green Star functionality criteria is met. The Renovation of the Nurses Residence will target both a 4-star design and a 4-star As-Built rating.
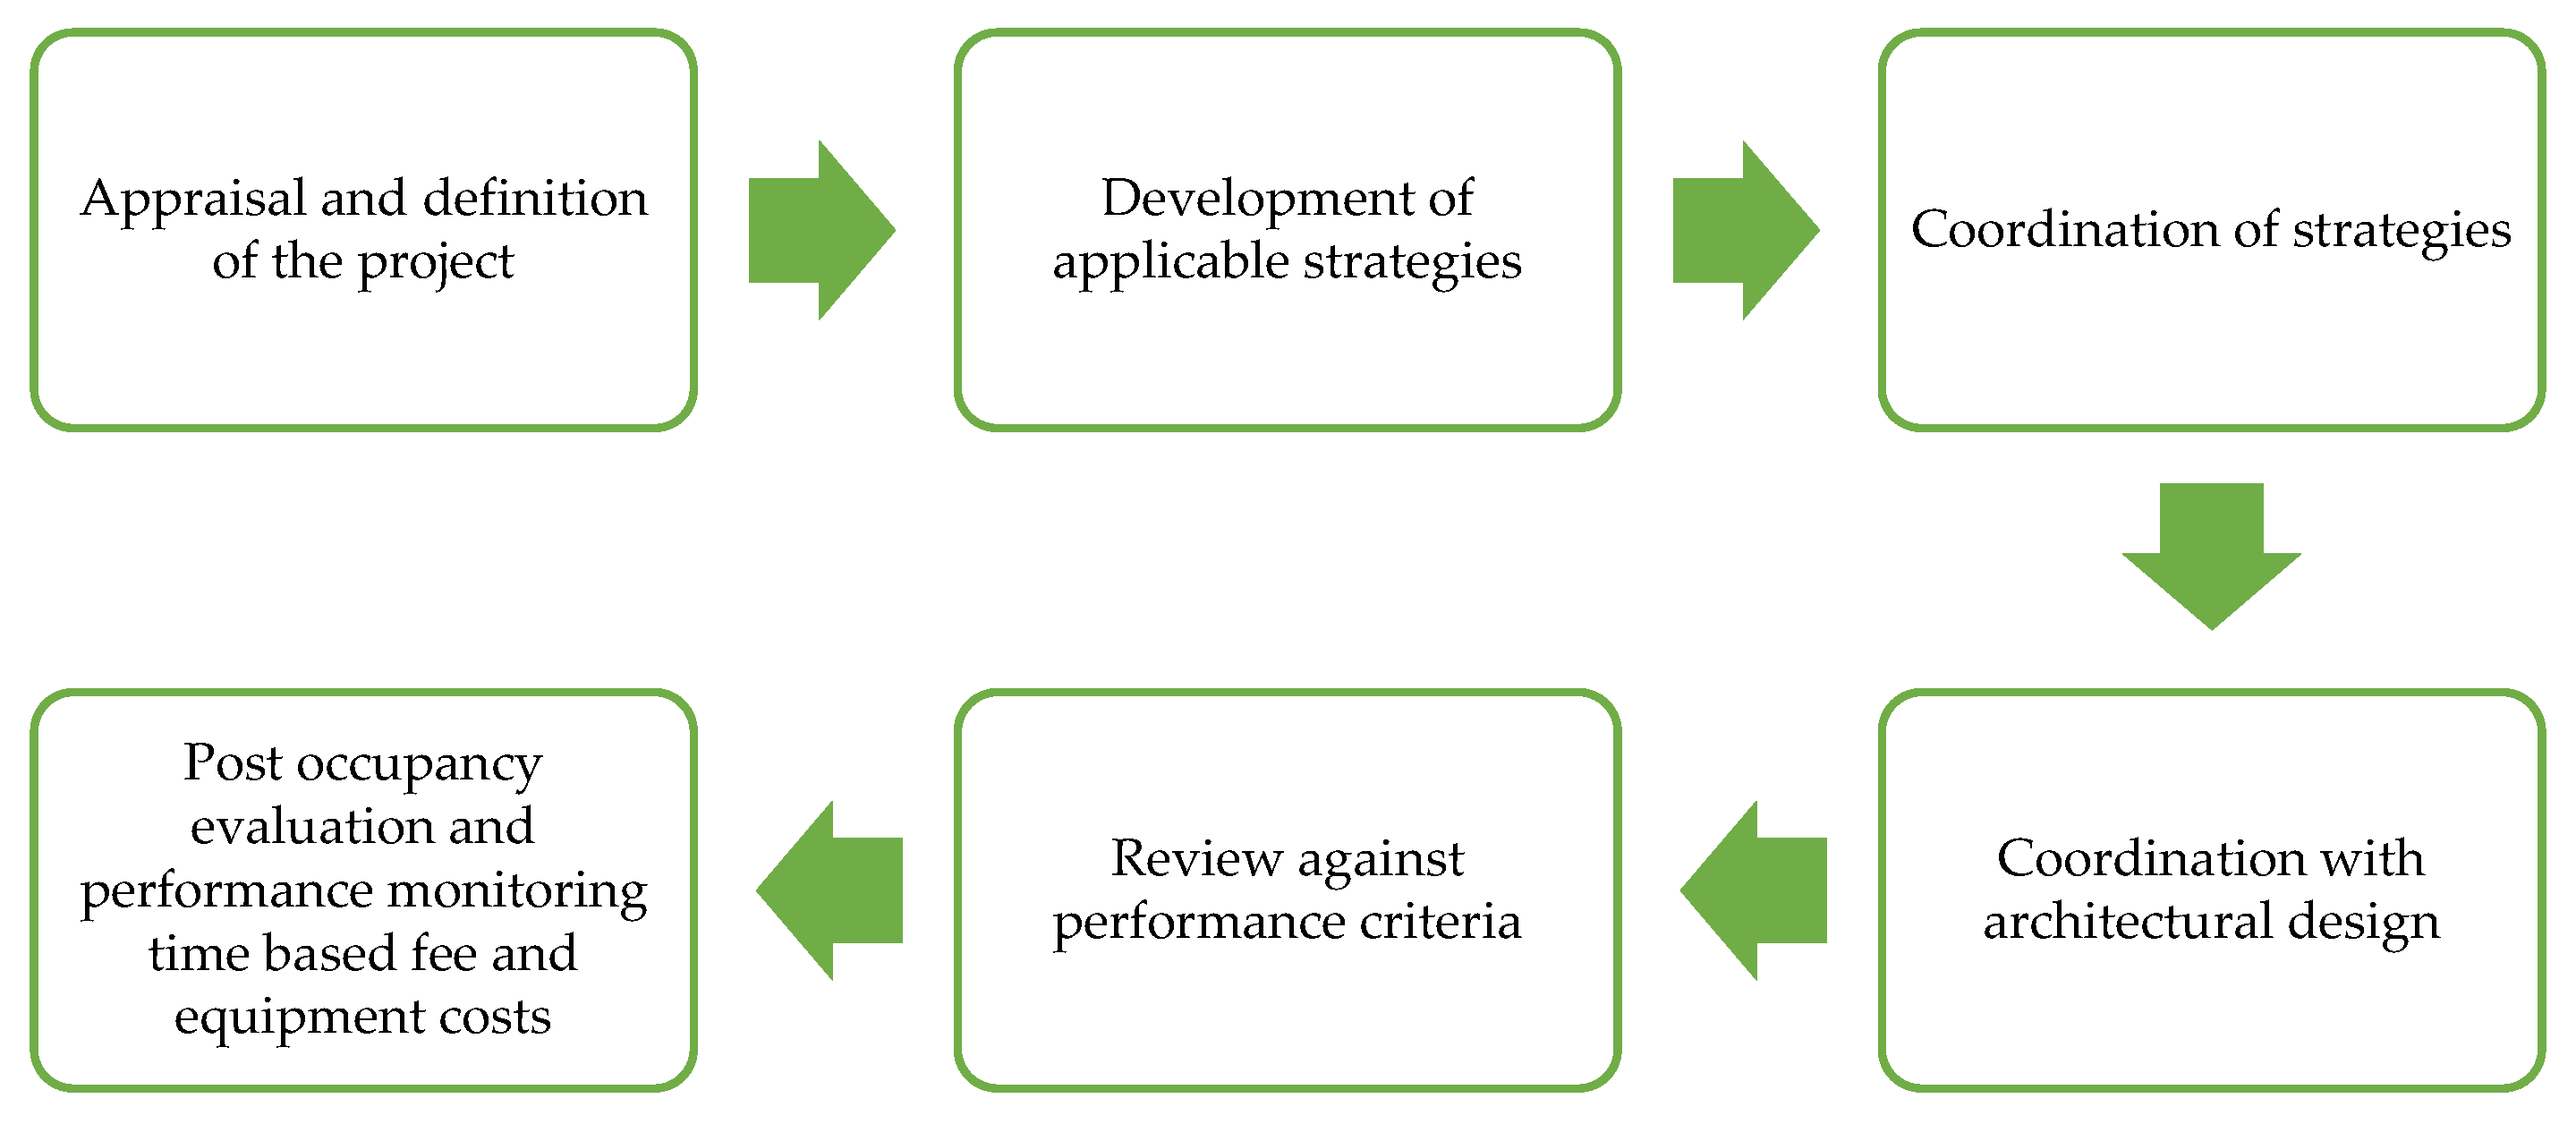
The following methods for each stage of the project life cycle are adopted for the energy strategies applicable to benchmarking in determining energy efficiency for both The EMS College of Emergency Care and The Nurses Residence, as illustrated in Figure 6:
3.1. Stage 1: Development of Brief—Appraisal and Definition of the Project
Identifying, quantifying, and interrogating the performance requirements for the different zones within the development with regards to regulations, quality, operation, comfort, cost, energy security, etc. Consideration of the macro climatic analysis in comparison to the micro climatic conditions [28,29].
3.2. Stage 2: Design Concept—Development of Applicable Strategies
- Solar control—establishing a solar control strategy;
- Natural lighting—establishing a natural lighting strategy;
- Thermal performance (dynamic and static) of the building envelope;
- Thermal zoning of the building according to loading and use;
- Hot water production.
In identifying the heating ventilation air conditioning (HVAC) (conventional and unconventional/mechanical and passive), and lighting strategies that are technically suitable to the local climate, the different space usage typologies within the building and the aesthetic and architectural character of the development are considered. In addition, identifying possible renewable energy strategies and providing concept-level costing information.
3.3. Stage 3: Design Development—Coordination of Strategies
Quantifying and interrogating the different building services strategies (passive, active and hybrid systems), which is identified in stage 2 against the performance criteria produced in stage 1, the systems include [28,29]:
- Comfort systems (e.g., air conditioning);
- Systems specific to the operations of the building;
- Lighting;
- Hot water production.
Coordinating and optimizing the design development of the building design and services with various consultants and specialists is vital. They assist in evaluating the capital cost of the thermal performance of the building against the capital and running cost of the comfort systems.
3.4. Stage 4: Technical Documentation—Coordination with Architectural Design
The preferred solar control strategy is implemented into the detailed design, and the input provided on the dimensioning and materials that have an impact on the solar control performance is carefully selected. The preferred natural lighting strategy is implemented into the detail design, and the input provided on dimensioning of fenestration and roof lights is considered. The preferred envelope thermal performance strategy is implemented, and the input provided on dimensioning of selected materials, insulation performance and transmittance of heat in and out of the building is considered. Coordinating the detailed design of the above elements with the mechanical and electrical services [28,29].
3.5. Stage 5: Contract Administration—Review against Performance Criteria
Support is provided in this phase to carry over the ownership of the strategies to the contractors and to review the construction against the required design performance. Commissioning, handover, and operation are monitored to evaluate if the actual development meets the performance and design criteria established in the initial two stages. Manual and occupant training, i.e., documentation from the previous stages, is provided to assist in carrying over the strategies to the actual occupants [27,29].
3.6. Stage 6: Post-Occupancy Evaluation and Performance Monitoring Time-Based Fee and Equipment Costs
Temporary data logging is installed in crucial locations to monitor the temperature performance of the building. Energy consumption of the different energy systems: HVAC, specialist use (retail, refrigeration, ovens, etc.) is monitored for comparison against energy performance targets established in stages 1 to 5. Final reporting on the evaluation and performance monitoring for costing needs to be performed [27,29].
4. Green Star Passive and Low-Energy Design Techniques
The design intention is to achieve a Green Building by paying careful attention to various aspects of the architectural design, materials used and energy-saving methods. Although additional costs will be incurred for the construction of a building, the result will always be of high quality, functional, and a healthy environment for the end user. The passive and low-energy design tools considered highlighting both electrical works and BMS.
The electrical design tools are as follows:
4.1. Building Tuning
The Green Star SA Office v1, Man-3 Building Tuning requires all electrical systems to be tuned in accordance. The below clauses specify the systems recommissioning and monitoring [29]:
- The entire electrical installation must be observed consistently for a time of one year after pragmatic culmination. The energy utilization of all electrical frameworks will be checked to guarantee that they are working as proposed by the initial design.
- Approval that the systems are executed to their design capacity throughout discrepancies in climate and occupancy.
- System performance and occupant needs to be matched by time schedules of optimization.
- The systems’ operation is to be configured by attributes that serve the built space.
- Confirm that the consumption of electrical energy is within the specified parameters, by taking monthly meter readings from all electrical equipment.
- Make certain that a maximum illuminance level of 400 lux is not surpassed everywhere in the building, by observing the lux levels on a monthly basis.
- Upon practical completion, i.e., after 12 months, a full recommission of the electrical installation needs to be performed. During the recommissioning process of the system, results taken in the previous 12 months from the Building Tuning report need to be considered. The analyses of the tuning and recommissioning process must be submitted to the project engineer and/or building owner in terms of a Building Tuning report.
4.2. High-Frequency Ballast
4.3. Energy Sub-Metering
Describe the installation requirements for electrical sub-meters, including a table of all sub-metered energy uses that have a load of 100 kVA of greater and separate metered lighting for every floor for 95% of the UA [29].
- Meters—each distribution board shall incorporate a kilowatt-hour/kVA fluorescent meter for measuring the energy consumed by the load.
- Each floor distribution board shall be sub-divided into different load types; lighting and power and supplied with energy meters capable of measuring the load type separately.
- The metering should include a mechanism for storing and monitoring data for the facility management to monitor energy consumption trends, example building management system (BMS).
- Any equipment with an electrical consumption of 100 kVA or more needs to be measured separately.
4.4. Lighting Zoning
Stipulate the requirements for switching and zoning [29]:
- Individual switching is to be performed for enclosed or singular spaces.
- The extent of individual lighting zones that are switched should be 100 m2 for 95% of the UA.
- Building occupants to access switching, which is clearly labelled.
4.5. Light Pollution
Categorizing of appropriate lighting and its necessities, e.g., lighting of internal and external areas [29]:
- No light beam, is to be focused randomly to the sky without dipping straight onto a non-transparent surface as created from within the building or outside of the building boundary.
- Average building luminance of at least 10 candelas/m2 is to be produced by a façade lighting.
- To maintain illuminance levels, the outdoor spaces at 95% of the minimum requirements of CIBSE LG6.
4.6. Generator Emissions
- Generators to conform with the Tier 3 emission standard as outlined by the United States Environmental Protection Agency (EPA) or the equivalent European Stage IIIA standard.
- If Tier 3 is not yet endorsed for a specific sized generator, the generator must conform to Tier 2 standards given in the EPA tables. As at December 2009, The ES IIIA standard is limited to generators below 560 kW.
The BMS design tools are as follows:
4.7. Building Tuning
All BMS monitoring systems shall be tuned in accordance with the requirements of the GBCSA’s Technical Manual as in Figure 7 [29].
- The entire BMS monitoring system shall be observed consistently for a time of one year after the pragmatic culmination
- Approval that the systems are executed to their design capacity throughout variations in climate and occupancy.
- System performance and occupant needs to be matched by time schedules of optimization.
- The systems’ operation is to be configured by attributes that serve the built space.
- Upon practical completion, i.e., after 12 months, a full recommission of the BMS monitoring systems needs to be performed. During the recommissioning process of the system, results taken in the previous 12 months from the Building Tuning report need to be considered. The outcomes of the tuning and recommissioning process are to be submitted as a Building Tuning report to the owner.
4.8. Energy Sub-Metering
Show that the energy meters are to be linked to the computerized building management system (e.g., BMS).
As highlighted above the design tools and methods need to be adopted in the initial stages of the design process. It is imperative to take into consideration the orientation of the building, its shape and cover as well as other factors.
5. Green Star Public and Education (PEB) Tools
The EMS College of Emergency Care utilizes the Green Star Public and Education (PEB) tool. This is designed specifically for public, community and educational projects. The EMS College of Emergency Care will target both a 6 Star Design and a 6 Star As-Built Rating. The previously selected categories in Section 2 and proposed initiatives for this paper are discussed below pertaining to an electrical design.
5.1. Management
The management category credits stimulate the implementation of green standards from the initiation of the project, design, and site handover stages to contracting, and tuning and application of the systems in the building. The credits targeted include [28,29,30]:
- Commissioning and tuning of all building systems in accordance with CIBSE, ASHRAE and Green Star requirements—this is to ensure all building systems are not limited to HVAC, electrical, wet services, metering and monitoring as intended by the design.
- Building Management System (sub-metering and monitoring is covered under energy and water)—a BMS will be incorporated into the building with functionality to examine and account on water and energy consumption, as well as to monitor and control building services systems.
5.2. Indoor Environment Quality (IEQ)
The credits within the IEQ category target the comfort of the inhabitants. The credits highlight how the lighting, cooling systems, heating and indoor air pollutants, and some building attributes promote a healthier indoor environment. The credits targeted include [28,44,45]:
- Electric lighting levels—the lighting design will be designed to achieve a maximum controlled illuminance level of 80% of the illuminance levels prescribed in SANS 10114–1:2005.
- Thermal comfort—additional HVAC controls will be specified to ensure a certain percentage of occupants are within a comfort range as prescribed by ISO 7730.
5.3. Energy
The Energy category target credits with an increased energy efficiency and reduced energy consumption. The credits targeted include [29,30,44]:
- Energy sub-metering—electrical sub-metering is specified for all applicable electrical uses within the building. This is specified distinctly for lighting and power, of which is approximately 95% of the building. Installation of an operative monitoring system to display all sub-meters and a computerized metering plan is set.
- Lighting zones—all individual or enclosed spaces are to be individually switched (manual or occupancy sensors). The size of independently switched lighting zones is not to exceed 100 m for 95% of the Nominated Area (NA). Manual switching is to be marked clearly and easy access by building residents. For 90% of the NA, provision for an autonomous addressable lighting system is to be made.
- Maximum reduction in electrical demand—the overall peak electrical demand is actively reduced by 30%. This will be achieved through the design and installation of photovoltaic panels and ice tanks.
- Unoccupied spaces—NAs attain a minimum of 90% of the unoccupied space criteria, for which the unoccupied space is air-conditioned. Integrated motion sensors will be used to achieve this credit.
5.4. Emissions
The Emissions category credits target the green effects of a development’s emissions or substances emitted from the site (excluding greenhouse gas emissions, which are dealt within the Energy category). The tools of Green Star SA rating aim at emissions comprising and involving light pollution, watercourse pollution, sewerage, and ozone depletion. The credits target includes [29,30,44]:
Light pollution—no light beam produced to be focused randomly to the sky without dipping straight onto a non-transparent surface. The façade lighting will yield an average building luminance of at least 10 cd/m2 (candelas per m2).
5.5. Innovation
The Innovation category allows projects to be implemented with new, first of its kind, game changing initiatives. These can be investigated in more detail and could be [29,30,44]:
- 100% LED design
- WELL building initiatives
6. Green Star Multi-Unit Residential V1 Tool
The Nurses Residence adopted the Multi-Unit Residential v1 rating tool. This is relevant to innovative multi-unit residential facilities, with additions and extensive restorations of present multi-unit residential facilities of two units or more. This is adopted, provided the Green Star functionality criteria are met. The Renovation of the Nurses Residence targeted both a 4-star design and a 4-star As-Built rating. The selected categories and proposed initiatives for this review are discussed below.
6.1. Management
Commissioning and tuning of all building systems in accordance with CIBSE, ASHRAE and Green Star requirements [46,47]—this is to ensure all building systems not limited to HVAC, electrical, wet services, metering, and monitoring are working as intended by the design. In addition, verify and adjust the system in line with season changes and occupant requirements [29,48,49].
6.2. Indoor Environment Quality
6.3. Energy
- Energy sub-metering—for common property services, sub-metering is provided for all substantive energy (electricity and gas) loads. Where present, sub-metering must be provided for common property energy generation systems (renewable and non-renewable). Installation of an operative monitoring system to display all sub-meters and a computerized metering plan are set. Electricity, gas, and domestic hot water energy must be sub-metered. Sub-meters are located within or directly adjacent to dwellings such that occupants have easy access to read consumption data [49,51,52].
7. Green Star Theoretical Modelling and Reporting
The decrease in energy utilization of the building is anticipated by looking at the utilization of the actual structure against a notional structure. The actual structure is modelled, utilizing the very same program (software) and climate information as the model of the notional structure, taking into consideration the HVAC and other building/ancillary systems. The following description applies for all three potential modelling-based credits.
7.1. ENE-1 Energy Model
This service provides an extensive whole-building energy model to show compliance with the Energy Modelling Protocol (EMP). This model is typically detailed and documented to show compliance and is not typically useful or changed fast enough to fit into the early design stages. The Energy Modelling report provides a review of the mechanical and electrical specifications and drawings to ensure consistency of documentation. For the As-Built submission, the model is reviewed and modified against the commissioning documentation, and the report is modified accordingly [29].
7.2. IEQ-9 Thermal Comfort Model
7.3. IEQ-4 Daylight
Provide the modelling and associated submission report for this credit. It includes the coordination of supporting documentation required from another consultant. For the As-Built submission the model is reviewed and modified against the As-Built documentation and the report modified accordingly. This service includes the daylight modelling of atria for IEQ-8 external views [29,46].
7.4. IEQ-5 Daylight Glare Control
Provide the modelling and associated submission report for this credit. It includes the coordination of supporting documentation required from other consultants. For the As-Built submission, the model is reviewed and modified against the As-Built documentation, and the report is modified accordingly [29].
7.5. IEQ-2 Air Distribution Effectiveness
This service provides a CFD model and associated report to show compliance with this credit. The IEQ-2 report is provided, and a review of the mechanical and electrical drawings is performed to ensure consistency of documentation. For the As-Built submission the model is reviewed and modified against the commissioning documentation and the report modified accordingly. An initial assessment is made to determine whether the credit is achievable or not. If not, the credit and modelling is aborted and only a portion of the designated fee is due for the initial modelling [29,46].
8. Project Scorecard and Costing Contributors—4- and 6-Star Rating
The analysis of the project scorecard as per point’s allocation for each category for the EMS College of Emergency Care and Renovation of Nurses Residence has been detailed and evaluated below. Each of the categories have been implemented with its methods and techniques of the discussed models.
8.1. EMS College of Emergency Care—6 Star
The project scorecard for the EMS College of Emergency Care is tabulated below as per the discussed categories, i.e., Management, Indoor Environmental Quality, Energy, Emissions, and Innovation.
As per points available for the Management category in Table 2, 3 points in total can be achieved for the chosen tasks. The functions defined above are accomplished agreement with CIBSE Commissioning Codes. Alternatively, the mechanical services make use of the HVAC commissioning process and the professional service provider and contractor shall handover project information to the building manager. As a result, a BMS is integrated into the building with functionality to examine and interpret the water and energy consumption as well as to control building services systems.
As per points available for the IEQ category in Table 3, 3 points in total can be achieved for the chosen tasks. As a result, the lighting design achieves a maximum maintained illuminance of 95% for a NA. The predicted mean value levels for thermal comfort are between −0.5 and +0.5 (inclusive) for at least 98% of occupied hours.
As per points available for the Energy category in Table 4, 9 points in total can be achieved for the chosen tasks. The electrical sub-metering is specified for all applicable electrical practices within the building. The sub-metering is thus stipulated individually for lighting and for power, i.e., at least 95% of the building. Therefore, an effective monitoring system is installed to monitor all sub-meters. The individual spaces are switched by either manual or occupancy sensors. These switched lighting zones are designed to not exceed at least 95% of the NA.
As per points available for the Emissions category in Table 5, a total of 1 point can be achieved for the chosen tasks. It is designed in a manner in which no light beam is to be focused randomly to the sky without dipping straight onto a non-transparent surface as created from within the building or outside of the building boundary. The average building luminance is to be of at least 10 cd/m2 and 95% of outdoor spaces is to not surpass the minimum conditions of CIBSE LG6 (Lighting Guide—the Outdoor Environment).
As per points available for the Innovation category in Table 6, 2 points in total can be achieved for the chosen tasks.
8.2. Renovation of Nurses Residence—4 Star
The project scorecard for the Renovation of Nurses Residence is tabulated below as per the discussed categories, i.e., Management, Indoor Environmental Quality, Energy, Emissions, and Innovation.
As per points available for the Management category in Table 7, 2 points in total can be achieved for the chosen tasks.
As per points allocation for the IEQ category in Table 8, 2 points in total can be achieved for the chosen tasks. It is considered to make use of a daylight illuminance of 150 lux or a daylight factor of no less than 1.5%.
As per points available for the Energy category in Table 9, 9 points in total can be achieved for the chosen tasks. It is noted that for each dwelling the interior lighting power density does not exceed 4.0 W/m2 (inclusive of parasitic losses). In addition, a minimum of 75% (by quantity) of all interior luminaries satisfy a minimum lamp luminous efficacy of 70 lm/W. All exterior luminaries are provided with presence detection and daylight control with each luminaire being less than 100 W.
8.3. Costing Contributors for Passive and Low-Energy Design Techniques
Considering the Green Star passive and low-energy design techniques for a building, the analysis of costing can be considered for each of the tools that contribute the most and/or the least in attaining a green building.
The tables below (Table 10 and Table 11) depict the tools from the most to the least expensive for a green building. The categories are concentrated around Energy and Indoor Environment Quality (IEQ) with specified design techniques that might have a direct/indirect cost to a green building.
Table 10 represents the tools from the energy category that have a direct/indirect cost contribution to a green building. The biggest contributor is Maximum Electrical Demand Reduction, with the least being Unoccupied Spaces. Due to the linking of solar panels, allowance of ice storage, and additional supports/builders work for the panels, the largest contributor poses to be maximum electrical demand reduction.
Table 11 represents the tools from the IEQ category that have a direct/indirect cost contribution to a green building. The biggest contributor is Electric Lighting Levels, followed closely by Thermal Comfort, with the least being External Views. Due to additional lighting specifications and HVAC controls, Electrical Lighting Levels and Thermal Comfort prove to be the largest contributors.
For all dwellings, the following demands (where provided) are sub-metered, i.e., electricity, gas and domestic hot water energy sub-meters are located within or directly adjacent to dwellings. This allows occupants to have easy access to reading consumption data for self-monitoring.
The lowest amount of maximum electrical demand reduction project proposals is integrated. Suitable maximum electrical demand reduction project proposals are: space warming, where a functioning space warming framework is introduced, which adopts a non-electric primary energy source. A non-electric primary energy source is installed for domestic hot water. Cooking appliances, i.e., all hobs, stoves and ovens installed, are non-electric. On-site energy generation is fitted and can deliver 200 W per occupant at the time of maximum electricity demand in the supply network. Smart metering “Smart Meters” are installed for hot water geysers to permit the function of switching off geysers automatically when the maximum electricity demand in the supply network is met.
In the main contract scope, provision for a minimum of two applicable appliances is to be allowed. The applicable appliance provided is to be certified with a minimum “B” rating of the European Energy Rating labelling system.
9. Performance Comparison between Passive and Low-Energy Design Techniques and Project Scorecard (4- and 6-Star Rating)
As per the Green Star Modelling and Report, key tools for modelling have been highlighted whilst trying to incorporate a BMS for the design. The model integrates energy, thermal comfort, daylight, daylight glare control and air distribution. In simulating the above tools for a building, it can be determined if a building is likely to achieve Green Star credits or not. As such, the above tools have been recommended for modelling and are to be implemented on a building.
In the passive and low-energy design requirements, it can be observed that various items contribute largely to obtaining a green building. It is imperative that Building Tuning be performed to achieve a compliant and energy-efficient electrical installation. This allows for periodic monitoring of the meter readings, lux levels, etc.
The use of high-frequency ballasts had to be installed for all fluorescent luminaires to achieve a lower lamp loading and improved lumen maintenance. This had to be implemented for at least 95% of the office’s usable area. The use of energy sub-metering makes it easier for the building manager/owner to include a mechanism for storing and monitoring data in monitoring energy consumption trends, i.e., a building management system (BMS). In performing lighting power density, the purpose was to boost and distinguish designs that offer artificial lighting with negligible energy consumption. The lighting zoning was covered by encouraging and recognizing the lighting design practices that provide better flexibility for light switching, making it easier to light only occupied areas and zones.
In analyzing the passive and low-energy design requirements, with specific mention to low-energy design for a building, it can be determined that modelling via different tools and adopting a BMS will contribute to optimizing a building by retrofitting and making it green overall (Green Star-rated). The proposed categories highlight specific green building characteristics and activities with a certain number of credits. The credits have points associated with them and a project team. As such, a calculation is performed for the targeted credits, which are assessed and scored as per the project scorecard.
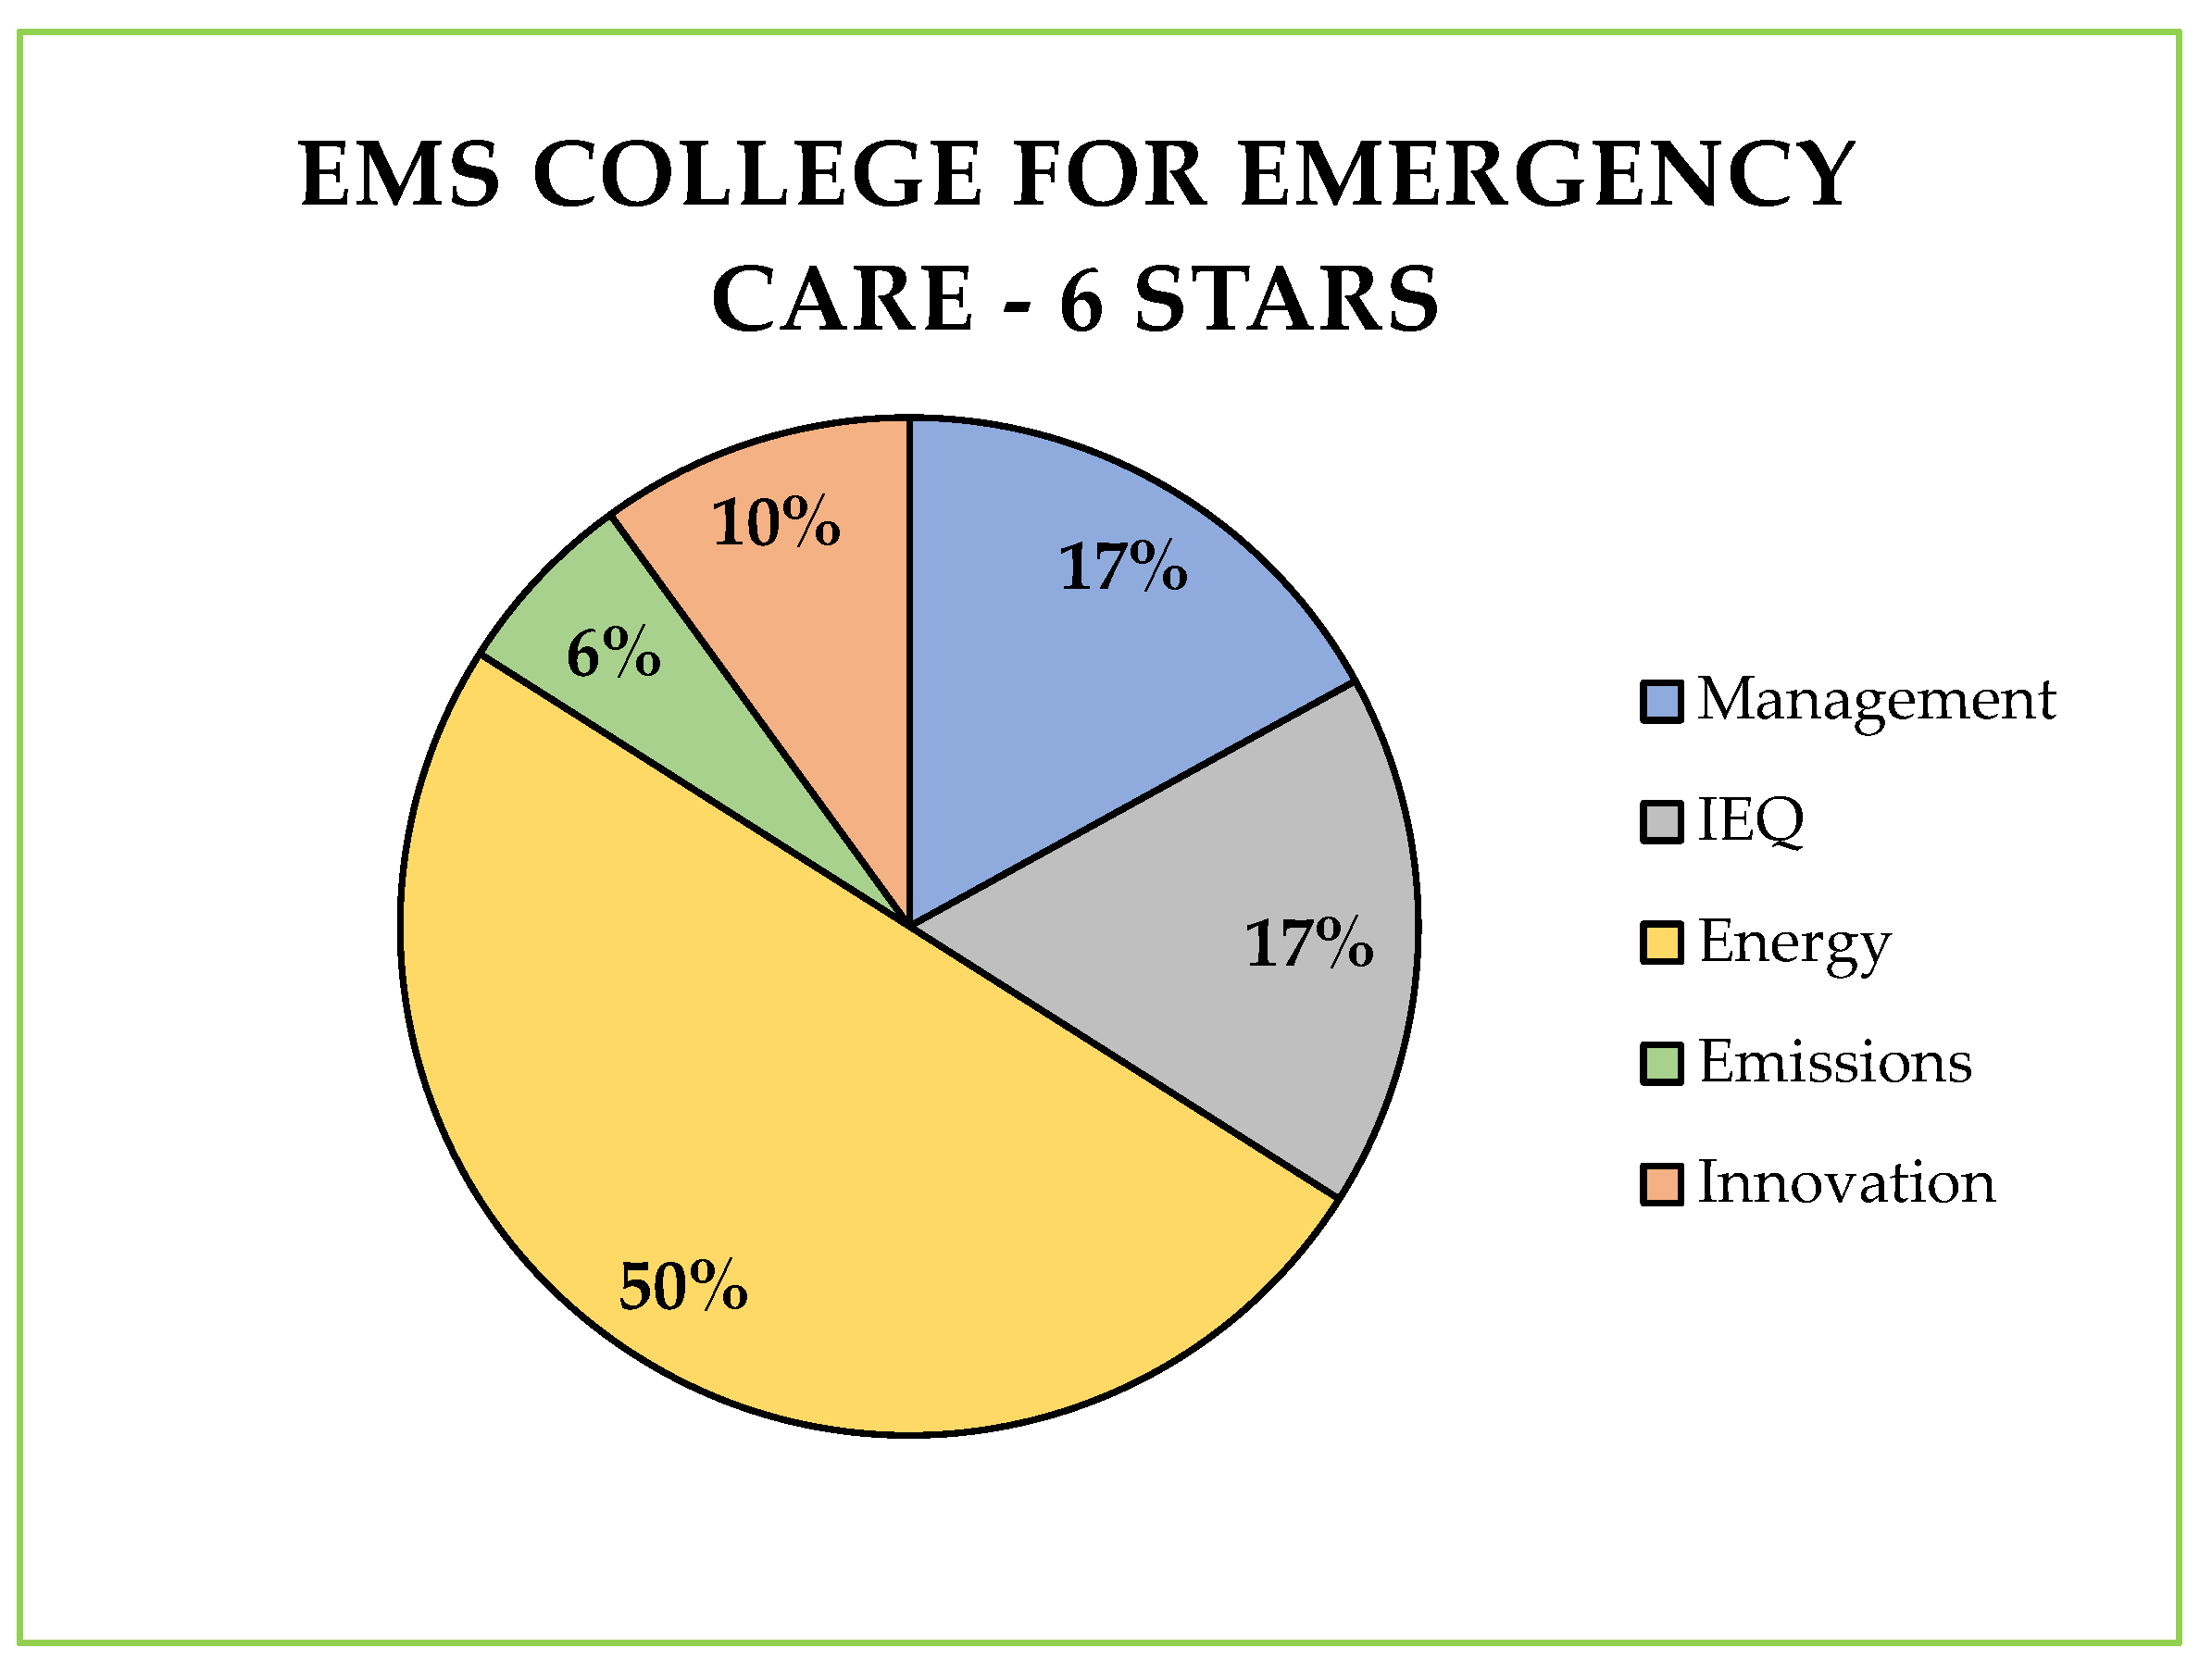
The project scorecard for the EMS College of Emergency Care targeted a 6-star rating, and the Renovation of the Nurses Residence targeted a 4-star rating. The credit details as per the project scorecard depict that a 4-star rating is easily obtainable and workable compared to a 6-star rating. The available points for each item are minimal as only a percentage of the credit detail is achievable, as in Figure 8 and Figure 9.
The pie charts in Figure 8 and Figure 9 illustrate the proposed categories that contribute the most to acquiring the targeted star-rated building. In addition, daylight and thermal comfort analysis have been factored into the credit details.
Figure 8 depicts the available points of a suitable 6-star-rated building. As can be seen, the energy category seems to have largely dominated in terms of acquiring maximum points to obtain a 6-star rating. Management and IEQ are closely related and follow behind the Energy Efficiency category.
Figure 9 illustrates the available points of a suitable 4-star-rated building. The energy category is prominent and encompasses many of the points that can be achieved. IEQ and Management share an equal portion in the contribution of the credit details.
As a result, each tool has specific weighting factors, which are applied to the scorecard to achieve a conclusive assessment. Hence, for every tool, the weighting differs from revealing the diverse green concerns in the several building sectors as depicted for both the EMS College for Emergency Care and Renovation of Nurses Residence.
In analyzing the tools that contribute the most/least to early design stages, the energy category is more favored than the indoor environment quality category. However, by incorporating both categories into a design, it is highly possible to attain a more energy-efficient and green building.
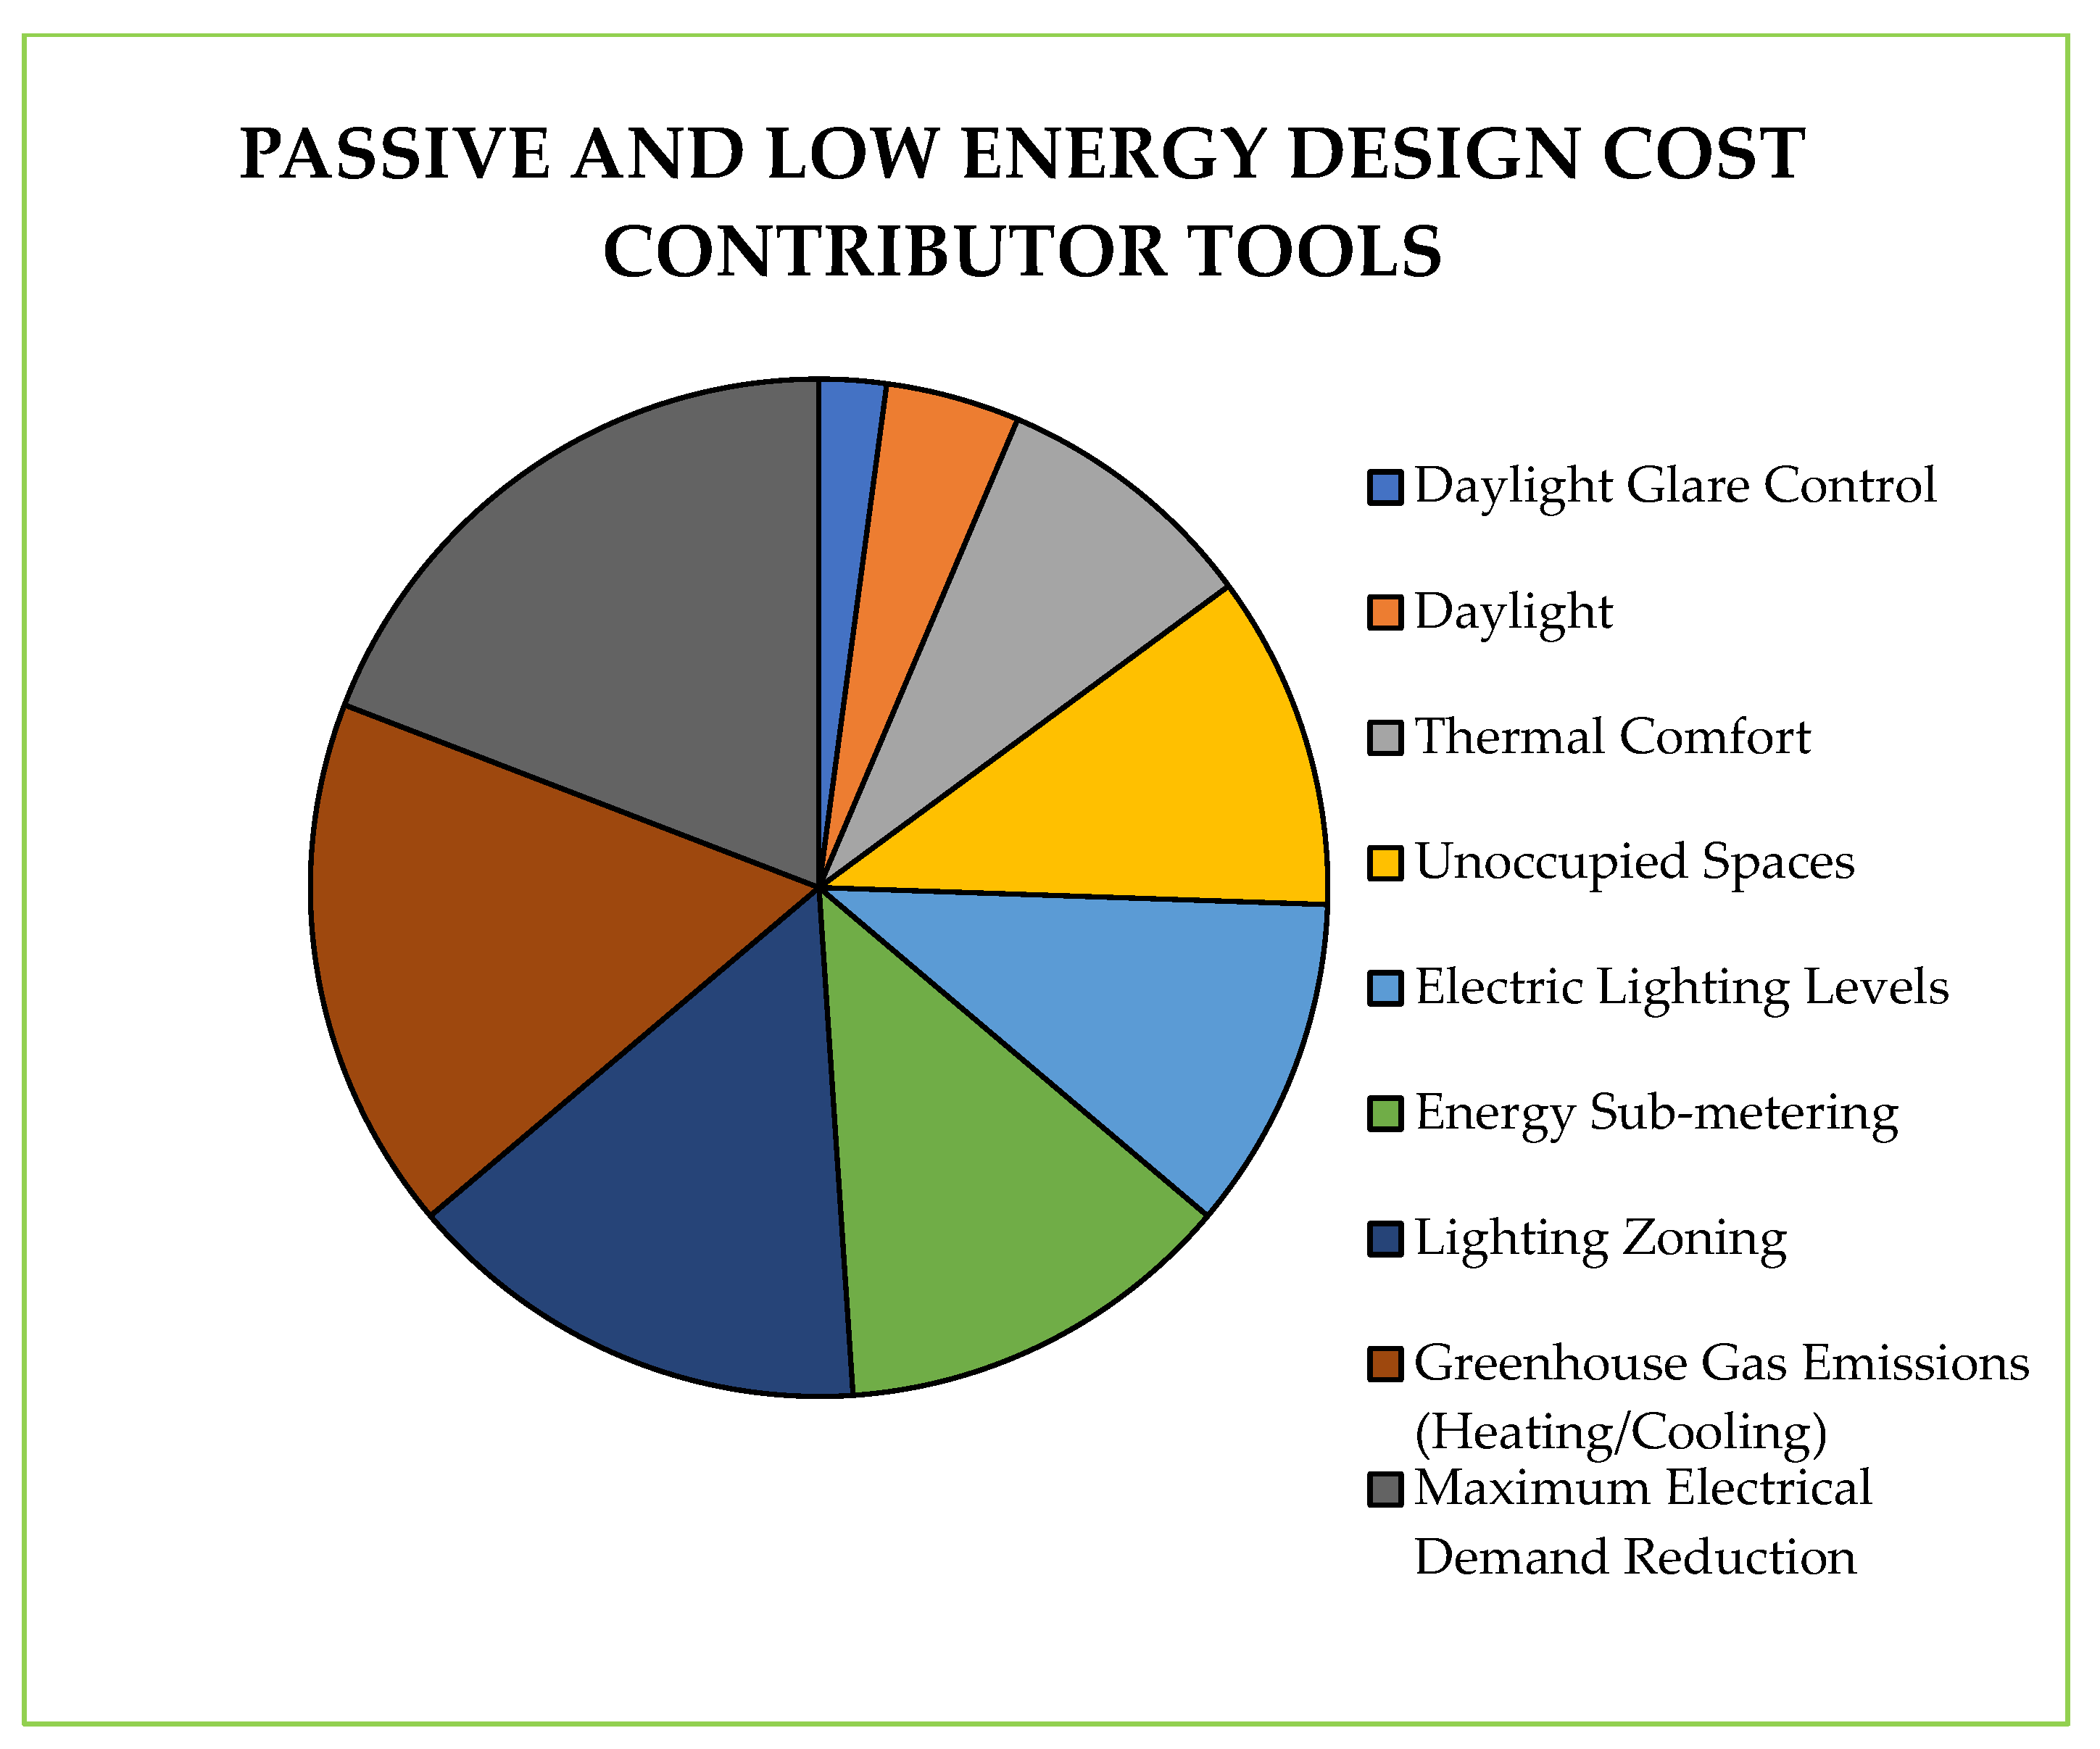
The pie chart in Figure 10 graphically represents the contributor tools that should be taken in the early design stages to obtain a green and energy-efficient building. As observed in the pie chart, the biggest cost contributor is Maximum Electrical Demand Reduction, and the lowest contributor is External Views. As such, the tools tabulated and graphically illustrated with each of its techniques gives the designer an idea of which is the largest/smallest contributing tool. By considering the proposed tools and techniques for modelling, a viable green building is targeted, and energy efficiency is optimized at the early design stages of the project.
10. Conclusions
The value of green buildings is not only from a cost breakdown strategy, with regards to savings on the life cycle cost analysis of the building, but also from the building users’ experience and overall health. The creation of environmentally responsible buildings leads to an improved environment for the end users as well as more sustainable architecture.
The Green Star Africa tools, together with its methods and techniques, have been used for the guide design and construction of the project and make specific mention of sustainability initiatives adopted. The EMS College of Emergency Care utilized the Green Star Public and Education (PEB) tool. This was designed specifically for public, community and educational projects. The EMS College of Emergency Care had targeted both a 6 Star Design and a 6 Star As-Built Rating. The Nurses Residence adopted the Multi-Unit Residential v1 rating tool. This was pertinent to innovative multi-unit residential facilities and additions to and major renovations of present multi-unit residential facilities of two units or more. The Renovation of the Nurses Residence targeted both a 4-star design and a 4-star As-Built rating. As such, the Green Star strategy has been presented, highlighting the different categories for which points were achieved in making the building green and acquiring a Green Star rating.
This paper reviews the proposed methods and techniques going forward for communicating the cultural values and unique aesthetics of buildings using passive and low-energy design methods. Moreover, this paper presents references for decision making for design by taking all-inclusive deliberation into the aesthetic and spatial concept and the focus of the design process consisting of passive design in its early stages. It is predicted that the importance of passive and low-energy design, as well as the optimization algorithms of green buildings, will continue to escalate in the future.
Therefore, additional findings are essential for the purpose of utilizing operative methods in electrical design by assessing and forecasting the environmentally friendly proficiencies of the passive design techniques presented in this paper. This will permit the conjecturing of environmentally friendly proficiencies in reducing the lifecycle cost in the early design stage. The passive and low-energy design thus consists of the combination of envelope design, space layout, and mechanical and electrical services. Future work is to investigate a simulated model linking the variables and relationship of the selected categories.
Author Contributions
All authors planned the study and contributed to the idea and information collection. Introduction, T.L.P.; methodology, T.L.P.; investigation, T.L.P.; resources, T.L.P.; data curation, T.L.P.; writing—original draft preparation, T.L.P.; writing—review and editing, T.L.P. and A.K.S.; visualization, A.K.S.; supervision, A.K.S.; project administration, A.K.S. All authors have read and agreed to the published version of the manuscript.
Funding
This research received no external funding.
Acknowledgments
I would like to generously thank and direct my gratitude to my supervisor, Akshay Kumar Saha, for familiarizing me with the Green Building environment, for his exceptional supervision, and for supporting me in paying attention to detail. I also wish to thank my family and friends for their constant support and myriad sacrifices.
Conflicts of Interest
The authors declare no conflict of interest.
Abbreviations
| ACO | Ant Colony Optimization | |
| ASHRAE | American Society of Heating, Refrigerating and Air Conditioning Engineers | |
| BMS | Building Management System | |
| CIDB | Construction Industry Development Board | |
| CSIR | Council for Scientific and Industrial Research | |
| DF | Daylight Factor | |
| DI | Daylight Illuminance | |
| DoPW | Department of Public Works | |
| EMP | Energy Modelling Protocol | |
| EPA | Environmental Protection Agency | |
| FFL | Finished Floor Level | |
| GA | Genetic Algorithm | |
| GBCSA | Green Building Council of South Africa | |
| HVAC | Heating, Ventilation and Air Conditioning | |
| IEQ | Indoor Environment Quality | |
| LG | Lighting Guide | |
| LCC | Life Cycle Cost | |
| NA | Nominated Area | |
| NBR | National Building Regulations | |
| NEES | National Energy Efficiency Strategy | |
| nZEB | Net Zero Energy Buildings | |
| PEB | Public and Education | |
| PSO | Particle Swarm Optimization | |
| SA | Simulated Annealing | |
| SANEDI | South African National Energy Development Institute | |
| SANS | South African National Standard | |
| TS | Tabu Search | |
| WELL | WELL Building Standard | |
References
- UNEP. Chapter 9, Buildings: Investing in Energy and Resource Efficiency. In Towards a Green Economy: Pathways to Sustainable Development and Poverty Eradication; United Nations Environment Programme, Sustainable Building and Climate Initiative: Nairobi, Kenya, 2011; Available online: www.unep.org/greeneconomy (accessed on 3 September 2022).
- GBCSA. Green Building Council of South Africa. Available online: www.gbcsa.org.za (accessed on 20 August 2022).
- GBPN. Buildings for Our Future, The Deep Path for Closing the Emissions Gap in the Building Sector. Green Buildings Performance Network. 2012. Available online: www.gbpn.org/reports (accessed on 10 September 2022).
- UNEP-SBCI (2009). South African Report on Greenhouse Gas Emission Reduction Potentials from Buildings; Discussion Document; Undertaken by the CIDB; United Nations Environment Programme, Sustainable Building and Climate Initiative: Nairobi, Kenya, 2009; Available online: www.unep.org/sbci (accessed on 4 September 2022).
- Shea, K.; Leubkeman, C. CDO: Computational design + optimisation in building practice. Arup J. 2005, 40, 17–21. [Google Scholar]
- Wong, J.K.; Li, H. Application of the analytic hierarchy process (AHP) in multi-criteria analysis of the selection of intelligent building systems. Build. Environ. 2008, 43, 108–125. [Google Scholar] [CrossRef]
- Chen, S.; Zhang, G.; Xia, X.; Setunge, S.; Shi, L. A review of internal and external influencing factors on energy efficiency design of buildings. Energy Build. 2020, 216, 109944. [Google Scholar] [CrossRef]
- Gholamzadehmir, M.; Del Pero, C.; Buffa, S.; Fedrizzi, R.; Aste, N. Adaptive-predictive control strategy for HVAC systems in smart buildings—A review. Sustain. Cities Soc. 2020, 63, 102480. [Google Scholar] [CrossRef]
- MDPI. Open Access Journals A–Z. Available online: https://www.mdpi.com/about/journals (accessed on 19 September 2022).
- Baldock, R. Structural Optimisation in Building Design Practice: Case-Studies in Topology Optimisation of Bracing Systems. Doctoral Dissertation, University of Cambridge, Cambridge, UK, 2007. [Google Scholar]
- Bergmann, M.; Binder, F.; Gajewski, R.; Motzko, C.; Zabielski, M.; Zieliński, B. Computer Methods in Construction; Construction Managers’ Library; Oficyna Wydawnicza Politechniki Warszawskiej: Warszawa, Polna, 2011. [Google Scholar]
- Elsevier. ScienceDirect. Available online: https://www.sciencedirect.com/ (accessed on 10 June 2022).
- DPW. Guidelines for the Implementation of Labour-Intensive Infrastructure Projects under the Expanded Public Works Programme, 2nd ed.; 2005. Available online: www.epwp.gov.za (accessed on 31 August 2022).
- The DTI. Construction Codes of Good Practice: 2000–2800 for Broad Based Black Economic Empowerment, Issues in terms of Section 9 (1) of the BBBEE Act 53, 2003, Notice 862 of 2009, Government Gazette No. 32305, Department of Trade and Industry. 2009. Available online: www.info.gov.za (accessed on 24 September 2022).
- CIDB. CIDB Standard for Indirect Targeting for Enterprise Development. Government Gazette 36190, 25 February 2013. Construction Industry Development Board. Available online: www.cidb.org.za (accessed on 27 August 2022).
- GBCSA Socio-Economic Category Pilot, Technical Manual Green Star SA, Green Building Council of South Africa. 2013. Available online: www.gbcsa.org.za (accessed on 4 September 2022).
- DPW. A National Framework for Green Building; Department of Public Works: Pietermaritzburg, KZN, South Africa, 2011. [Google Scholar]
- DoE. Draft Second National Energy Efficiency Strategy Review; Gazette Notice 1000 of 2012, Gazette 35920; Department of Energy: Pretoria, South Africa, 2012. [Google Scholar]
- Papalambros, P.Y.; Wilde, D.J. Principles of Optimal Design: Modeling and Computation; Cambridge University Press: Cambridge, UK, 2000. [Google Scholar]
- van Eck, N.J.; Waltman, L. VOSviwer. In Centre for Science and Technology Studies; Leiden University: Leiden, The Netherlands, 2020; Available online: https://www.vosviewer.com/ (accessed on 10 September 2022).
- Alam, M.R.; Reaz, M.B.I.; Ali, M.A.M. A Review of Smart Homes—Past, Present, and Future. IEEE Trans. Syst. Man Cybern. Part C Appl. Rev. 2012, 42, 1190–1203. [Google Scholar] [CrossRef]
- Liao, T.W.; Egbelu, P.J.; Sarker, B.R.; Leu, S.S. Metaheuristics for project and construction management–A state-of-the-art review. Autom. Constr. 2011, 20, 491–505. [Google Scholar] [CrossRef]
- Rosłon, J.; Zawistowski, J. Construction Projects’ Indicators Improvement Using Selected Metaheuristic Algorithms. Procedia Eng. 2016, 153, 595–598. [Google Scholar] [CrossRef] [Green Version]
- Jaśkowski, P.; Sobotka, A. Scheduling construction projects using evolutionary algorithm. J. Constr. Eng. Manag. 2006, 132, 861–870. [Google Scholar] [CrossRef]
- Bożejko, W.; Hejducki, Z.; Wodecki, M. Applying metaheuristic strategies in construction projects management. J. Civ. Eng. Manag. 2012, 18, 621–630. [Google Scholar] [CrossRef] [Green Version]
- Zhou, J.; Love, P.E.; Wang, X.; Teo, K.L.; Irani, Z. A review of methods and algorithms for optimising construction scheduling. J. Oper. Res. Soc. 2013, 64, 1091–1105. [Google Scholar] [CrossRef] [Green Version]
- Weglarz, J. (Ed.) Project Scheduling: Recent Models, Algorithms and Applications; Springer Science & Business Media: Berlin/Heidelberg, Germany, 2012; Volume 14. [Google Scholar]
- Lutolf, R. Smart Home Concept and the Integration of Energy Meters into a Home Based System. In Proceedings of the Seventh International Conference on Metering Apparatus and Tariffs for Electricity Supply, Glasgow, UK, 17–19 November 1992; IET: London, UK, 1992; pp. 277–278. [Google Scholar]
- Ibadov, N. Fuzzy estimation of activities duration in construction projects. Arch. Civ. Eng. 2015, 61, 23–34. [Google Scholar] [CrossRef]
- Książek, M.V.; Nowak, P.O.; Kivrak, S.; Rosłon, J.H.; Ustinovichius, L. Computer-aided decision-making in construction project development. J. Civ. Eng. Manag. 2015, 21, 248–259. [Google Scholar] [CrossRef] [Green Version]
- Lee, K.S.; Lee, J.Y.; Lee, J.S. Low-Energy Design Method and Its Implementation in Architectural Practice: Strategies for Energy-Efficient Housing of Various Densities in Temperate Climates. J. Green Build. 2013, 8, 164–183. [Google Scholar] [CrossRef]
- Miller, N.W. Keeping it together: Transient stability in a world of wind and solar generation. IEEE Power Energy Mag. 2015, 13, 31–39. [Google Scholar] [CrossRef]
- Guttromson, R.T.; Chassin, D.P.; Widergren, S.E. Residential Energy Resource Models for Distribution Feeder Simulation. In Proceedings of the IEEE Power Engineering Society Annual Meeting, Toronto, ON, Canada, 13–17 July 2003; PNNL-SA-38072. Pacific Northwest National Laboratory: Richland, WA, USA, 2003. [Google Scholar]
- Murray, M.R.; Astrom, K.J.; Boyd, S.P.; Brockett, R.W.; Stien, G. Future Directions of Control in an Information-Rich World. IEEE Control. Syst. Mag. 2003, 23, 20–33. [Google Scholar]
- Scherer, H.F.; Pasamontes, M.; Guzmán, J.L.; Álvarez, J.D.; Camponogara, E.; Normey-Rico, J.E. Efficient building energy management using distributed model predictive control. J. Process Control. 2014, 24, 740–749. [Google Scholar] [CrossRef]
- Longe, O.M.; Ouahada, K.; Rimer, S.; Ferreira, H.C. Optimisation of energy expenditure in smart homes under time-of-use pricing. In Proceedings of the 2015 IEEE Innovative Smart Grid Technologies—Asia (ISGT ASIA), Bangkok, Thailand, 3–6 November 2015; pp. 1–6. [Google Scholar]
- Chakraborty, T.; Datta, S.K. Home automation using edge computing and internet of things. In Proceedings of the 2017 IEEE International Symposium on Consumer Electronics (ISCE), Kuala Lumpur, Malaysia, 14–15 November 2017; pp. 47–49. [Google Scholar]
- Bresnen, M.; Edelman, L.; Newell, S.; Scarbrough, H.; Swan, J. Social practices and the management of knowledge in project environments. Int. J. Proj. Manag. 2003, 21, 157–166. [Google Scholar] [CrossRef]
- Smith, R.G. The Contract Net Protocol: High-Level Communication and Control in a Distributed Problem Solver. IEEE Trans. Comput. 1980, C-29, 1104–1113. [Google Scholar] [CrossRef]
- Bröchner, J.; Ang, G.; Fredriksson, G. Sustainability and the performance concept encouraging environmental technology in construction. Build. Res. Inf. 1999, 27, 368–373. [Google Scholar] [CrossRef]
- Labuschagne, C.; Brent, A.C. Sustainable project life cycle management: The need to integrate life cycles in the manufacturing sector. Int. J. Proj. Manag. 2005, 23, 159–168. [Google Scholar] [CrossRef] [Green Version]
- Geidl, M.; Koeppel, G.; Favre-Perrod, P.; Klockl, B.; Andersson, G.; Frohlich, K. Energy hubs for the future. IEEE Power Energy Mag. 2007, 5, 24–30. [Google Scholar] [CrossRef]
- Chicco, G.; Mancarella, P. Exploiting small-scale cogeneration in energy-related markets. In Proceedings of the IEEE PowerTech., Lausanne, Switzerland, 1–5 July 2007. [Google Scholar]
- Kulejewski, J.; Ibadov, N. Construction project scheduling with imprecisely defined constraints. Czas. Techniczne. Bud. Tom R. 2010, 107, 231–247. [Google Scholar]
- Danish, E.M. Development of Post-2015 National Energy Efficiency Strategy, Targets, Measures and Implementation Plan; Department of Energy: Pretoria, South Africa, 2016; pp. 2–3. [Google Scholar]
- GBCSA. Green Building of South Africa Guide; GBCSA: Pretoria, South Africa, 2015; pp. 12–36. [Google Scholar]
- Neumann, K.; Schwindt, C.; Zimmermann, J. Project Scheduling with Time Windows and Scarce Resources: Temporal and Resource-Constrained Project Scheduling with Regular and Nonregular Objective Functions; Springer Science & Business Media: Berlin/Heidelberg, Germany, 2012. [Google Scholar]
- Government of SA. National Climate Change Response White Paper; Department of Environment: Pretoria, South Africa, 2011. [Google Scholar]
- Attia, S.; Hamdy, M.; O’Brien, W.; Carlucci, S. Assessing gaps and needs for integrating building performance optimisation tools in net zero energy buildings design. Energy Build 2013, 60, 110–124. [Google Scholar] [CrossRef]
- Zhao, Z.; Lee, W.C.; Shin, Y.; Song, K.B. An optimal power scheduling method for demand response in home energy management system. IEEE Trans. Smart Grid 2013, 4, 1391–1400. [Google Scholar] [CrossRef]
- Wang, Z.; Yang, R.; Wang, L. Multi-agent control system with intelligent optimisation for smart and energy-efficient buildings. In Proceedings of the IECON 2010—36th Annual Conference on IEEE Industrial Electronics Society, Glendale, AZ, USA, 7–10 November 2010; pp. 1144–1149. [Google Scholar]
- Dalamagkidis, K.; Kolokotsa, D.; Kalaitzakis, K.; Stavrakakis, G.S. Reinforcement learning for energy conservation and comfort in buildings. Build. Environ. 2007, 42, 2686–2698. [Google Scholar] [CrossRef]
Figure 1.
Flow chart of overall design building process [2].
Figure 1.
Flow chart of overall design building process [2].

Figure 2.
Engineering optimization steps for rated buildings [11].
Figure 2.
Engineering optimization steps for rated buildings [11].

Figure 3.
Simplified framework of dynamic relationship between variables.

Figure 4.
The GBCSA process in achieving certification.

Figure 5.
Energy Reduction Proposals: ASHRAE 90,1 and 189 [44].
Figure 5.
Energy Reduction Proposals: ASHRAE 90,1 and 189 [44].

Figure 6.
Methods for each stage of the project life cycle.

Figure 7.
Category weightings for 4 and 6 Green Star.

Figure 8.
Percentage of credit details for 6-star rating.

Figure 9.
Percentage of credit details for 4-star rating.

Figure 10.
Ranking of design cost contributor tools.


Table 1.
Green Star SA rating as a quality factor [28].
Table 1.
Green Star SA rating as a quality factor [28].
| Rating | Score | Represents | |
|---|---|---|---|
| One Star | 10 | Minimum Practice | ✩ |
| Two Star | 20 | Average Practice | ✩✩ |
| Three Star | 30 | Good Practice | ✩✩✩ |
| Four Star | 45 | Best Practice | ✩✩✩✩ |
| Five Star | 60 | South African Excellence | ✩✩✩✩✩ |
| Six Star | 75 | World Leadership | ✩✩✩✩✩✩ |
Table 2.
Project scorecard EMS College—Management category.
| Category | Points | Description |
|---|---|---|
| MAN02 Commissioning | 2 | Commissioning [CIBSE/ASHRAE] and project knowledge transfer |
| MAN10 Building Management Systems | 1 | Integrated BMS |
Table 3.
Project scorecard EMS College—IEQ category.
| Category | Points | Description |
|---|---|---|
| IEQ07 Electric Lighting Levels | 1 | 95% nominated area luminance |
| IEQ 09 Thermal Comfort | 2 | Mechanically ventilated spaces, (PMV) between −0.5 and +0.5 |
Table 4.
Project scorecard EMS College—Energy category.
| Category | Points | Description |
|---|---|---|
| EN02 Energy sub-metering (Electrical) | 2 | Electrical and lighting sub-metering |
| EN04 Lighting Zones | 3 | Individually switched zones—addressable lighting |
| EN05 Maximum Electrical Demand Reduction | 2 | 30% peak electrical demand reduction |
| EN11 Unoccupied Spaces | 2 | 90% of nominated space achieves the unoccupied space, for air-conditioned spaces |
Table 5.
Project scorecard EMS College—Emissions category.
| Category | Points | Description |
|---|---|---|
| EMI07 Light Pollution | 1 | Light pollution (Lighting guide—outdoor environment) |
Table 6.
Project scorecard EMS College—Innovation category.
| Category | Points | Description |
|---|---|---|
| INN01 Innovative Strategies and Technologies | 2 | 100% LED, Motion sensors, Timer switches, WELL building initiatives, etc. |
Table 7.
Project scorecard Nurses Residence—Management category.
| Category | Points | Description |
|---|---|---|
| MAN02 Commissioning | 2 | Transfer project knowledge |
Table 8.
Project scorecard Nurses Residence —IEQ category.
| Category | Points | Description |
|---|---|---|
| IEQ04 Daylight | 2 | 90% daylight in habitual area |
Table 9.
Project scorecard Nurses Residence —Energy category.
| Category | Points | Description |
|---|---|---|
| ENE02 Energy Metering | 1 | Common sub-metering services |
| ENE02 Energy Metering | 1 | Sub-metering per dwelling |
| ENE03 Lighting Energy Use | 3 | 70 lM/W interior and exterior dwelling lighting |
| ENE05 Maximum Energy Demand Reduction | 2 | Electrical demand reduction design initiatives |
| ENE10 Energy-Efficient Appliances | 2 | More efficient appliances |
Table 10.
Credit summary for energy.
| Item | Tools | Code | Design Cost Contributor |
|---|---|---|---|
| 01 | Maximum Electrical Demand Reduction | ENE-5 | Link to solar, ice storage, additional supports and builders works for panels |
| 02 | Greenhouse Gas Emissions (Heating/Cooling) | ENE-1 | Additional builders work and coordination, external plant |
| 03 | Lighting Zoning | ENE-4 | Lighting specifications |
| 04 | Energy Sub-metering | ENE-2 | Electrical sub-metering and thermal metering |
| 05 | Unoccupied Spaces | ENE-11 | Integrated motion sensors |
Table 11.
Credit summary for IEQ.
| Item | Tools | Code | Design Cost Contributor |
|---|---|---|---|
| 01 | Electric Lighting Levels | IEQ-7 | Additional lighting specifications |
| 02 | Thermal Comfort | IEQ-9 | Additional HVAC controls |
| 03 | Daylight | IEQ-4 | Possible additional glazing |
| 04 | Daylight Glare Control | IEQ-5 | Blinds |
| 05 | External Views | IEQ-8 | No direct costs |
Publisher’s Note: MDPI stays neutral with regard to jurisdictional claims in published maps and institutional affiliations. |
© 2022 by the authors. Licensee MDPI, Basel, Switzerland. This article is an open access article distributed under the terms and conditions of the Creative Commons Attribution (CC BY) license (https://creativecommons.org/licenses/by/4.0/).
Share and Cite
MDPI and ACS Style
Pillay, T.L.; Saha, A.K. Passive, Low-Energy Design and Green Star Strategy for Green Star-Rated Buildings in South Africa. Energies 2022, 15, 9128. https://doi.org/10.3390/en15239128
AMA Style
Pillay TL, Saha AK. Passive, Low-Energy Design and Green Star Strategy for Green Star-Rated Buildings in South Africa. Energies. 2022; 15(23):9128. https://doi.org/10.3390/en15239128
Chicago/Turabian StylePillay, Theogan Logan, and Akshay Kumar Saha. 2022. "Passive, Low-Energy Design and Green Star Strategy for Green Star-Rated Buildings in South Africa" Energies 15, no. 23: 9128. https://doi.org/10.3390/en15239128
Note that from the first issue of 2016, this journal uses article numbers instead of page numbers. See further details here.