A Nature’s Curiosity: The Argonaut “Shell” and Its Organic Content
by
 , , and
Morgane Oudot
1,* ,
,
Ira Ben Shir
2, 
Asher Schmidt
2,
Laurent Plasseraud
3,
Cédric Broussard
4,
Pascal Neige
1 and
Frédéric Marin
1 1
UMR CNRS 6282 Biogeosciences, University of Burgundy-Franche-Comté, 6 Boulevard Gabriel, 21000 Dijon, France
2
Schulich Faculty of Chemistry and Russell Berrie Nanotechnology Institute Technion-Israel Institute of Technology, Technion City, Haifa 32000, Israel
3
Institute of Molecular Chemistry, ICMUB UMR CNRS 6302, University of Burgundy-Franche-Comté, 9 Avenue Alain Savary, 21000 Dijon, France
4
3P5 Proteomic Platform, Cochin Institute, 22 Rue Méchain, Paris, France, 3P5 Proteomic Platform, University of Paris, Cochin Institute, INSERM, U1016, CNRS, UMR8104, F-75014 Paris, France
*
Author to whom correspondence should be addressed.
Crystals 2020, 10(9), 839; https://doi.org/10.3390/cryst10090839
Submission received: 5 August 2020
/
Revised: 9 September 2020
/
Accepted: 15 September 2020
/
Published: 19 September 2020
(This article belongs to the Special Issue Biominerals: Formation, Function, Properties)
Abstract
:Molluscs are known for their ability to produce a calcified shell resulting from a genetically controlled and matrix-mediated process, performed extracellularly. The occluded organic matrix consists of a complex mixture of proteins, glycoproteins and polysaccharides that are in most cases secreted by the mantle epithelium. To our knowledge, the model studied here—the argonaut, also called paper nautilus—represents the single mollusc example where this general scheme is not valid: the shell of this cephalopod is indeed formed by its first dorsal arms pair and it functions as an eggcase, secreted by females only; furthermore, this coiled structure is fully calcitic and the organization of its layered microstructures is unique. Thus, the argonautid shell appears as an apomorphy of this restricted family, not homologous to other cephalopod shells. In the present study, we investigated the physical and biochemical properties of the shell of Argonauta hians, the winged argonaut. We show that the shell matrix contains unusual proportions of soluble and insoluble components, and that it is mostly proteinaceous, with a low proportion of sugars that appear to be mostly sulfated glycosaminoglycans. Proteomics performed on different shell fractions generated several peptide sequences and identified a number of protein hits, not shared with other molluscan shell matrices. This may suggest the recruitment of unique molecular tools for mineralizing the argonaut’s shell, a finding that has some implications on the evolution of cephalopod shell matrices.
1. Introduction
Molluscs constitute a highly diversified phylum, widely famous for being expert mineralizers: the phylum contains eight taxonomic classes from which five, including monoplacophorans, scaphopods, bivalves, gastropods and cephalopods, are shell-bearing organisms [1]. Among them, the shell biomineralization is known to be a genetically controlled matrix-mediated process, performed extracellularly. The organic matrix consists of a complex mixture of proteins, glycoproteins, lipids and polysaccharides that are secreted by a calcifying tissue, generally known as the external calcifying epithelium of the mantle for most molluscs. These components are then released in the extrapallial space, together with mineral ion precursors, where they are supposed to interact and self-assemble [2]. In this context, the matrix is thought to fulfil several functions: locally concentrating ions, providing a scaffold for mineral deposition, catalysing the mineral deposition, nucleating crystals and controlling their shape, and finally, inhibiting the crystal growth under certain circumstances [3]. Since its discovery as a key-player in shell biomineralization, the organic matrix has been the focus of a large number of biochemical analyses, mainly on its protein moieties [4,5,6,7,8,9]. But in spite of numerous studies, the components of the organic matrix are known mostly for two molluscan clades: the bivalves and the gastropods. In contrast, cephalopods which represent a major class of molluscs in past and present ecosystems, with about 800 living and more than 10,000 fossil species (http://cephbase.eol.org/ [10]), remain far less studied. Since their appearance in the Middle Cambrian [11], they experienced a complex evolutionary history with important radiations into a great variety of marine habitats, punctuated by major crises [10,12,13]. The macroevolutionary history of the clade points out an interesting fact from a “biomineralization” point of view: a general trend of shell reduction and internalization, up to its complete disappearance in the most recent cephalopods, octopods. Among the latter, one cephalopod stands out as an exception: the argonaut.
Argonauts belong to a family (Argonautidae) of pelagic octopuses that inhabit tropical and temperate oceans [14,15]. This family comprises only one living genus, Argonauta and four described species, world widely known for their beautiful thin white shell, also named the paper nautilus shell. This unique feature among octopods is only produced by females and used as a brood chamber as well as a hydrostatic structure for attaining neutral buoyancy [16,17]. But most importantly, this calcified structure is not a “true” shell: in contrast to other shell-bearing cephalopods and molluscs in general, it is not produced by the calcifying epithelium of the mantle, the organ responsible for secreting the shell [18]. In fact, the argonaut shell is a secondary calcium carbonate structure, synthesized from webs on the distal ends of the female’s first dorsal arm pair, resulting in a different shell organization [19]. Thus, the argonaut shell is not homologous to that of other cephalopods and constitutes a derived character—i.e., an apomorphy—of the Argonautidae family. Since this character is not found in any other molluscan clade, present or past, and is consequently unique to argonautids, it can even be considered as an autapomorphy. Another peculiarity of this calcified structure is that it is entirely calcitic, unlike all other calcified cephalopod shells, external (Nautilus) or internal (Spirula, Sepia). Over the decades, the microstructure of the argonaut shell has been the subject of a number of studies [19,20,21], but the biochemistry of the organic matrix is extremely lacunar. In the present study, we focus on one species of paper nautilus, Argonauta hians, also known as the winged argonaut and named the grey sea-horse’s nest by the Chinese. It is a cosmopolitan species living in tropical and inter-tropical pelagic waters, and abundant in the Philippines and in the South China Sea. Our study aims at shedding light on the biochemical components of the shell, and at comparing this biochemical fingerprint with known data from other representatives of the Mollusca phylum.
2. Materials and Methods
2.1. Shell Sampling
Shells of Argonauta hians were bought online on Conchology website (www.conchology.be). Four cleaned specimens of 61, 70, 73 and 75 mm in diameter, respectively, were provided, all coming from the Philippines. Figure 1 shows one of them. Three specimens were sampled off Negros Island, with two exemplars collected in the Hinigaran waters, and the third one, in that of Cadiz. The fourth specimen was collected off Leyte Island, in the district of Sogod. One of these shells was exclusively used for embedding, microstructural analyses and lectin and immuno-localization. The three others were used for matrix extraction.
2.2. Shell Embedding and Microstructure Analysis
Shell fragments were embedded in LR (London Resin) White resin, following the manufacturer’s instructions (Fluka): benzoyl peroxide (catalyst) was dissolved in the LR White resin monomer solution (9.9 g per 500 mL) for 24 h, under constant stirring, at room temperature, prior to use. The samples were immersed in the resin solution at room temperature before being transferred at 60 °C for the polymerization to proceed (one night to two days). Resin blocks were then sliced with a saw microtome (Leica SP1600, Leica Biosystems, Nussloch, Germany): shell sections were polished under water with decreasing grain size sandpaper until reaching mirror-polish quality (0.05 µm, aluminium oxide). After short sonication, the preparations were slightly etched with EDTA solution (1% wt/vol, 2 min), before being dried and carbon or gold-sputtered. The samples were finally observed with a Hitachi TM-1000 (Hitachi, Tokyo, Japan) tabletop SEM or with a JEOL JSM-IT 100 InTouchScope™ (JEOL Ltd., Tokyo, Japan).
2.3. Shell Matrix Extraction
Prior to extraction, two cleaning procedures were applied: the first one consisted of coarsely powdering the first shell (referred to as Shell 1) with a mortar and pestle and bleaching the fragments in a 10-times diluted sodium hypochlorite solution (Merck, 0.6–1.4% active chlorine, ref 105614) for 20 h. The second one, applied on the second shell (referred to as Shell 2) added an additional step: after the first bleaching, the powder was divided in two batches: the first one was kept untreated further while the second one was submitted to another bleaching step (20 h, NaOCl solution, same dilution). After several rinsing steps in ultrapure water, all bleached powders were dried at 37 °C and manually ground. They were immediately weighed and decalcified overnight, at 4 °C by adding progressively cold dilute acetic acid (10% vol/vol) at a flow rate of 0.1 mL every 5 s, under constant stirring (according to the protocol of [22]). The clear solutions were centrifuged (3900 G, 30 min): each supernatant, containing the CH3CO2H-soluble matrix (acid soluble matrix—ASM) was filtered (5 µm, Millipore) on a Nalgene filtration device before being ultrafiltered for volume reduction on an Amicon stirred cell (model 8400, 400 mL, cutoff 10 kDa). The concentrated solution (15 mL) was dialyzed against ultrapure water for three days (5–6 changes of water) and lyophilized. In parallel, the precipitate that contained the CH3CO2H-insoluble matrix (acid insoluble matrix—AIM) was rinsed via 5 cycles of resuspension in ultrapure water—centrifugation, each time the supernatant being added to the ASM in the Amicon cell. Finally, the AIM pellet was lyophilized. All six dried pellets were weighed on a precision balance (Quintix35-1S, Sartorius, Göttingen, Germany) four times and the mean value was calculated. Since the double bleaching procedure on Shell 2 yielded very low amount of matrix (in particular, of an insoluble one), only few characterizations were performed on these extracts, including FT-IR and proteomics. The third shell was used only for the quantification of matrix components: to this end, we employed the same protocol as the one for Shell 1. All the results are included in Table 1.
2.4. Quantification of Sugars and Sulfated Glycosaminoglycans
The whole sugar content of the ASM was tested according to the classical sulfuric acid-phenol method [23], applied to smaller volumes adapted to microplates [24,25]. In brief, in eppendorf tubes, 200 µL of ASM sample, diluted from a 5 µg/µL stock solution, was allowed to react with 500 µL concentrated sulfuric acid. To the mixture, 100 µL phenol 5% was immediately added and the solution was allowed to cool down for ten min before being incubated at 37 °C for 30 min. Standard solutions of glucose and maltose (amounts ranging from 0 to 56 µg per well, i.e. 200 µL) were treated in parallel in a similar manner. Aliquots (200 µL, 1/4 of the total volume) were pipetted in a 96-well microplate. For each sample and standard concentration, triplicates were made. The test was read at 490 nm on a microplate reader (Bio Rad, model 680, Hercules, CA, USA) and a standard curve was traced.
The sulfated glycosaminoglycans (sGAGs) were quantified according to the Blyscan assay (Ref. B1000, Biocolor Ltd., Antrim, UK). In short, in eppendorf tubes, 100 µL of diluted samples and of reference standards (bovine tracheal chodroitin-4-sulfate) were allowed to react at room temperature with Blyscan dye reagent (900 µL) for 30 min under constant agitation. The tubes were then centrifuged for 12 min at 15,600 G, for generating pellets of dye-glycosaminoglycans complexes. The supernatants containing unbound dye were discarded, and the pellets were re-dissolved in 500 µL of dissociation reagent under vortexing. After a short centrifugation, aliquots (125 µL, 1/4 of the total amount) were disposed in triplicates in a 96-well microplate, which was subsequently read at 655 nm. A standard curve was traced for quantification.
2.5. Mono-Dimensional PAGE
Both matrix fractions (ASM and AIM of Shell 1) were analyzed by conventional mono-dimensional denaturing SDS-PAGE (Bio-Rad, Mini Protean III gels, Hercules, CA, USA), on precast gradient gels (Mini-PROTEAN TGX Gel 4–15% acrylamide, 90 mm × 70 mm, Bio-Rad) or on homemade gels (12% polyacrylamide). This technique allows overall viewing of the matrix macromolecules by discriminating them according to their molecular weights. The ASM lyophilisates were dissolved in ultrapure water to a concentration of 5 µg/µL (stock solution). An aliquot was sampled, to which 4X Laemmli Sample Buffer (LSB, 1/4 of the final volume) was added. Chips of the AIM pellets were resuspended in ultrapure water, to which a similar proportion of LSB solution was added. All preparations were heat-denatured for 5 min at 100 °C for the ASMs and 10 min for the AIMs. Note that the AIMs were partly solubilized by LSB. Only the soluble fractions, referred to as LS-AIMs (Laemmli Soluble-Acid Insoluble Matrix), were visualized on gels and the most insoluble fractions were not tested further. The preparations were cooled down on ice and shortly centrifuged before being applied on the top of the gel. Subsequently, gels were stained with Bio-Rad blue dye, silver nitrate [26] and carbocyanine, i.e., “Stains-all” [27].
2.6. Fourier Transform Infra-Red Spectroscopic Characterization (FT-IR)
FT-IR spectroscopy allows the non-destructive characterization of chemical functions of a sample by passing an IR beam through it. It was performed to check both the shell mineralogy of A. hians and the overall chemical properties of the matrix fractions (ASM and AIM). Minute amounts of samples (shell powder ≈ 1–5 mg powder, freeze-dried chips of ASM and AIM ≈ 100–500 µg) were analysed with an FT-IR Bruker Alpha spectrometer (Bruker Optics Sarl, Marne la Vallée, France) fitted with an Attenuated Total Reflectance (ATR) ALPHA-P device equipped with a mono-reflection diamond crystal in the 4000–375 cm−1 wavenumber range (24 scans at a spectral resolution of 4 cm−1). The qualitative assignment of absorption bands was performed by comparison with previous spectra descriptions, achieved by our group or available in the literature. An additional spectrum was acquired from commercial crab chitin (Sigma, C9752).
2.7. Solid State Nuclear Magnetic Resonance (SSNMR)
Solid-State NMR (SSNMR) is well suited to identify the occurrence and assess the composition of bioorganic matter within the inorganic matrix of intact shells or after demineralization. A specific advantage of 13C MAS NMR is that it holds out the prospect of quantification of the relative amounts of differing constituents of the sample, whether as whole shell or partial extract. An additional advantage is its ability to identify the structural forms of the calcareous inorganic matrix—crystalline and/or amorphous—and interactions with the bioorganics. [28,29].
13C, 31P Magic Angle Spinning (MAS) NMR measurements were carried out on 300 MHz solid state NMR Bruker AVANCE III spectrometer using a 4 mm triple-resonance MAS NMR probe with zirconia rotors. Samples were spun at 10,000 ± 2 Hz. Cross polarization (CP) followed by chemical shift echo [30] was employed using π/2 and π pulses of 5.0 and 10.0 μs widths, and an echo interval of 100 μs identical to the rotor period TR; TPPM 1H decoupling [31] with rf field strength of 100 kHz. The Hartmann–Hahn CP contact employed1 ms and 2 ms duration and 50 kHz rf level for the X-channel (13C and 31P, respectively) and 30–70 kHz ramped rf level for the 1H channel with. DE MAS spectra employed the same respective parameters. A sample of the AIM1 extract (20 mg), a lyophilized sample of the ASM1 extract (34 mg), and a sample of cleaned shell powder (110 mg) were packed in 4 mm rotors and their 13C and 31P CPMAS spectra were obtained by acquiring 2–70 k and 2–8 k transients, respectively, using a 3 s relaxation delay. The SSNMR signature of Argonauta hians AIM was compared to that of other shell matrices, including a chitinous matrix (Spirula spirula) and a proteinaceous one (Arctica islandica). A chitin spectrum was also acquired as a reference.
2.8. In Vitro Interference Test with Calcium Carbonate
The effect of the ASM on the growth of calcium carbonate crystals was tested in vitro, as previously described [32,33]. In this assay, crystal growth was obtained by slow diffusion of NH4HCO3 vapor into the CaCl2 solution. To this end, a 10 mM CaCl2 solution was prepared fresh, filtered (5 μm) and used for serial dilutions of ASM in the range (0.5–32 μg/mL). The solutions were incubated in a 16-well culture slide (Lab-Tek, Nunc/Thermo Scientific, Rochester, NY, USA), covered with a plastic cover, which had been pierced in the center of each well. The whole culture slide was sealed using parafilm “M” laboratory film (Neenah, WI, USA) and incubated for four to six days at room temperature in a desiccator containing ammonium bicarbonate crystals. Blank controls were performed without ASMs. In parallel, a similar experience was performed on the ASM extract of Spirula spirula in order to compare its effect on calcification with that of A. hians.
Following the incubation, the wells were carefully dried by gently removing the solution via a blunt-ended syringe needle connected to a vacuum pump. Slides were dried at 37 °C and disassembled and the glass plate was directly observed using a TM1000 tabletop scanning electron microscope (Hitachi) in back-scattered electron mode. To guarantee the reproducibility of the results, the crystallization assay was performed 5 times, each time with a blank control and under the same conditions.
2.9. ELISA
ELISA assay allows quantifying the interaction of an antibody with an antigen, in the present case, the ASM in a microplate. The two batches of ASM (1 and 2) were checked for their ability to cross-react with 18 different antibodies developed against unfractionated or partly fractionated soluble shell matrices or against purified soluble shell proteins (see Table S1 for information on these antibodies, including their target antigens and their respective dilutions of use). In brief, the ASM, diluted in TBS buffer, was incubated in a Maxisorb 96-well microplate (Nunc TM, Rockslide, Denmark) at 37 °C for 90 min. The plate was subsequently rinsed (TBS/Tween) then blocked with 1% gelatin diluted in TBS (30 min) then with the antibody preparations. Each antibody was tested in quadruplicate. The microplate was rinsed, incubated 90 min at 37 °C with GAR-AP (goat anti-rabbit, alkaline phosphate) conjugate (1/30,000, Sigma ref. A3687). After extended rinsing step, the plate was developed with substrate buffer (aqueous solution of diethanolamine (10 mL) supplemented with 5 mg p-nitrophenyl phosphate). The microplate was read every 15 min at 405 nm on a multichannel microplate reader (Bio-Rad, model 680).
2.10. Westernblot
Westernblot combines SDS-PAGE and ELISA, by visualizing on a membrane (on which a gel was electro-transferred) macromolecules that cross-react with a given antibody. After SDS-PAGE migration under denaturing conditions, proteins were transferred for 80 min (intensity kept constant at 115 mA, starting voltage 50 V) to a polyvinylidene difluoride membrane (PVDF) following the “wet-blotting” protocol of Matsudaira [34]. The membrane was subsequently treated as follows: blocking with gelatin/TBS solution, incubation with the most cross-reacting antibody, the anti-P95 one (elicited against P95 protein from the nacre of the freshwater mussel U. pictorum [35], rinsing steps with TBS/tween (7 times), incubation with the secondary antibody (GAR-AP, Sigma, ref. A3687), rinsing steps with TBS/tween (7 times) and development with the chemoluminescent substrate CDP-Star. The signal was captured by contact with a X-Omat photo film (Kodak®) in a development cassette. Alternatively, the Western-blot membrane was incubated with Sigma Fast BCIP/ NBT (Sigma, ref. B5655) all-in-one tablets, until intense purple staining occurred. The staining was stopped by rinsing the membrane in water and drying it between two Whatman papers.
2.11. Immunogold Labeling
Immunogold labeling aims at visualizing in situ an antigen (directly on the sample surface), owing to a cross-reacting antibody, which is itself recognized by a secondary antibody coupled to gold particles. This experiment was performed from freshly broken shell fragments [36]. The samples were firstly etched with EDTA 1% for two min and then rinsed twice (2 × 5 min) with TBS. All incubation steps were performed in 12-well plates (MaxiSorp, Nunc™, Rockslide, Denmark) except the last silver-enhancement step performed in 96-well plates (MaxiSorp, Nunc™, Rockslide, Denmark). We used α-P95 antibody, similarly to the Western-blot assay. The shell fragments were blocked for at least 30 min in a filtered (5 µm) gelatin solution (1% w/vol) diluted in TBS, pH adjusted to 8 with NaOH. The shell fragments were incubated overnight in TBS/gelatin (0.5% wt/vol)/Tween 20, pH 8 containing the first antibody (α-P95; dilution 1:1500). The samples were thoroughly rinsed 10 times with TBS/Tween20 and incubated 90 min with a goat anti-rabbit antibody conjugated to 5 nm gold particles (British Biocell International, ref. EM. GAR5, diluted 100 times). The shell fragments were thoroughly rinsed with TBS/Tween20 and the gold particle size was further increased, by incubation in a two components silver-enhancing solution (British Biocell International, ref. SEKL15) for 15 min. The samples were rinsed with ultrapure water, dried, and directly observed with a Hitachi TM1000 SEM. The experiment was performed four times. In each experiment, 4 negative controls were undertaken: one without first antibody, one without the second one, one without both of them, and a complete blank (without any treatment).
2.12. Enzyme-Linked Lectin Assay (ELLA)
Enzyme-Linked Lectin Assay (ELLA) is based on the same principle as ELISA, except that the tested antibodies are replaced by lectins, proteins that target specific sugar structures. Screening of Argonaut ASMs by Enzyme-Linked Lectin Assay (ELLA) was performed using a set of 21 biotinylated lectins (Vector Labs, Kits I to III, BK-1000, BK-2000, BK-3000). The binding preferences and specificities of each lectin are indicated in the supplementary information of an earlier publication [37].
The test was carried out in 96-well microplates (MaxiSorp, Nunc™, Rockslide, Denmark): the Argonauta ASM diluted in TBS buffer (200 ng/well) was incubated for 90 min at 37 °C, immediately followed by three washing steps with TBS/Tween20. Wells were blocked with 1X concentrated Carbo-free blocking solution (Vector Labs, ref. SP-5040) for at least 30 min at 37 °C. The diluted lectins (in TBS/Tween20) were incubated into the microplate for 90 min at 37 °C, at the following dilution factors: 200 times for kits I and II, and 100 times for kit III. After three washes with TBS/Tween20, the microplates were incubated with a diluted solution of avidin-alkaline phosphatase conjugate (1:70000, ref. Sigma A7294, St. Louis, MO, USA) for 90 min at 37 °C, for the detection of bound biotinylated lectins. They were then washed five times with TBS/Tween20 and revealed with a substrate solution containing aqueous diethanolamine (9.7% vol/vol, pH adjusted to 9.8 with HCl) and phosphatase substrate (0.5 mg/mL, pNPP Tablet, Sigma, St. Louis, MO, USA). The microplates were read at 405 nm every 15 min (BioRad Model 680, Hercules, CA, USA). A check of the background signal without ASM, lectin or Avidin-AP showed no reaction with the substrate solution. This test was performed with quadruplicates of each lectin and the results were normalized and translated in percentages of reactivity by subtracting the background and considering the highest response as 100%. The test was performed three times.
2.13. Lectin-Gold Labeling
Lectin-gold labeling consists in localizing in situ, directly on shell surfaces, sugar structures with a given lectin. Following the ELLA results, lectin-gold labeling was performed with shell fragments, which were previously etched with EDTA 1% for two min and then rinsed twice with TBS 1x, for 5 min each time. This test was carried out in 96-well plates (MaxiSorp, Nunc™, Rockslide, Denmark). A specific lectin used for this in situ labeling was chosen on the basis of the previous ELLA results: the most reactive lectin, i.e., concanavalin A (ConA) was used. Following the protocol of Kanold et al. [37], the shell fragments were blocked with a CarboFree solution (ref. above) at least one hour, then incubated overnight with the diluted biotin-conjugated lectins (1:100), thoroughly rinsed 5 times with TBS/Tween20, and incubated for 2 h with a goat anti-biotin antibody conjugated with ultrasmall 0.8 nm gold particles (Aurion, Wageningen, The Netherlands, ref. SKU: 100.088, dilution × 100). The shell fragments were thoroughly rinsed with TBS/Tween20 and the gold particle size was further increased, by incubating the shell fragments in a two components silver-enhancing solution (British Biocell International, ref. SEKL15) for 15–20 min. The samples were then rinsed, dried and directly observed with a Hitachi TM1000 SEM.
2.14. Proteomic Analysis of the Shell Extracts
The aim of proteomics is the identification of proteins in a complex mixture, after their enzymatic digestion. The resulting peptides are analysed by tandem mass-spectrometry. Their signature is compared to that of databases, in order to infer the protein content of the sample. MS/MS analyses were conducted on the four unfractionated bulk matrices, ASM and AIM, which were digested in-gel, after a short migration in an 12% acrylamide gel stained with colloidal Coomassie blue. In-gel digestions were carried out with trypsin. Samples were de-stained twice with a mixture of 100 mM ammonium bicarbonate (ABC) and 50% (v/v) acetonitrile (ACN) for 30 min at 22 °C and then dehydrated using 100% ACN for 15 min, before being reduced with 25 mM ABC containing 10 mM DTT (dithiothreitol) for 1 h at 56 °C and alkylated with 55 mM iodoacetamide in 25 mM ABC for 30 min in the dark at 22 °C. Gel pieces were washed twice with 25 mM ABC and dehydrated (twice, 20 min) with 100% ACN. Gel cubes were incubated with sequencing grade modified trypsin (Promega, Madison, WI, USA; 12.5 ng/µL in 40 mM ABC with 10% ACN, pH 8.0) overnight at 37 °C. After digestion, peptides were extracted twice with a mixture of 50% ACN–5% formic acid (FA) and then with 100% ACN. Extracts were dried using a vacuum centrifuge Concentrator plus.
Mass spectrometry (MS) analyses were performed on a Thermo Fisher Scientific U3000 RSLC nano-LC system coupled to an Orbitrap Fusion Tribrid mass spectrometer (Thermo Fisher Scientific). After drying, peptides were solubilized in 10 µL of 0.1% trifluoroacetic acid (TFA) containing 10% acetonitrile (ACN). One µL was loaded, concentrated and washed for 3 min on a C18 reverse phase precolumn (3 µm particle size, 100 Å pore size, 75 µm inner diameter, 2 cm length from Thermo Fisher Scientific). Peptides were separated on a C18 reverse phase resin (2 µm particle size, 100 Å pore size, 75 µm inner diameter, 25 cm length from Thermo Fisher Scientific) with a 1 hour gradient starting from 99% of solvent A containing 0.1% FA in H2O and ending in 90% of solvent B containing 80% ACN, 0.085% FA in H2O. The mass spectrometer acquired data throughout the elution process and operated in a data-dependent scheme with full MS scans acquired with the Orbitrap, followed by MS/MS HCD (higher-energy collision-induced dissociation) fragmentations acquired with the Ion Trap on the most abundant ions detected in top speed mode for 3 s. Resolution was set to 60,000 for full scans at AGC target 2 × 10⁵ within 60 ms maximum injection ion time (MIIT). The MS scans spanned from 350 to 1500 m/z. A precursor selection window was set at 1.6 m/z, and the MS/MS scan resolution was set with AGC target 2 × 10⁴ within 100 ms MIIT. HCD Collision Energy was set at 30%. Dynamic exclusion was set to 30 s duration. For the spectral processing, the software used to generate .mgf files was Proteome Discoverer 1.4 (ThermoFisher Scientific). The mass spectrometry data were analyzed using Mascot v2.5 (Matrix science) on “Other Metazoa” (11,084 sequences) from the SwissProt databank containing 559,634 sequences; 201,129,965 residues (April 2019). A second search was performed, against the transcriptome of the Ram’s Horn squid Spirula spirula (Sequence Read Archive (SRA) accession reference PRJNA302677), as well as against the genome of Octopus bimaculoides (SRA accession reference PRJNA270931). In each case, the enzyme specificity was Trypsin’s and up to 1 missed cleavage was tolerated. The precursor mass tolerance was set to 4 ppm and the fragment mass tolerance to 0.56 Da for fusion data. Carbamidomethylation of cysteins residues and oxidation of methionines residues were set as variable modifications.
We are fully aware that proteomics, when performed alone, i.e., without the support of a transcriptome constructed from the calcifying tissue of the same species, gives less information than when the proteomics/transcriptomics approaches are coupled. However, it gives a peptidic fingerprint and a first overview of a matrix content. Because of this limitation, the stringency of in silico analyses is lower; consequently, some results may be moderately significant and should be confirmed by subsequent analyses.
3. Results
3.1. Shell Microstructures
The shell of Argonauta hians is entirely calcitic, as shown by the IR spectrum depicted in Figure 2, and which displays in particular a single absorption band at 712 cm–1 (ν4 CO32–, C–O in plane bending), a sharp band at 870 cm–1 (ν2 CO32−, out-of-plane bending) and a broad band at 1392 cm–1 (ν3 CO32–, asymmetrical stretching) [38]. SEM observations of the shell microstructure (Figure 2) confirmed that the shell consists of one central thin “core” layer and, from either side, of two thick layers of thin calcite fibers. The core layer is irregular in thickness (from 9 to 27 µm) and sinuous. Observations in back-scattered electron mode show that it is darker than the adjacent calcitic ones, suggesting a partly organic nature. At the interface between the core and the mineralized layers, needles emerge from spherulites, i.e., bundles of radiating needles that grow from one spot. Each spot is separated from its closest neighbors by a quasi-invariant distance of 8–10 microns. Both fibrous layers vary in thickness. Around the enrollment axis, the shell appears macroscopically thicker and stronger (personal observations). There, an equatorial section of the shell evidences the starting point of the central core, which is wrapped by the fibrous calcite (Figure 3). On the aperture of the shell, on the dorsal side, one observes the central core edge, which gets progressively occluded into the calcite. This occlusion appears as a two-steps process: first, the formation of a calcite bevel on each side of the organic core; then the overall structure is wrapped in a continuous layer of calcite. Finally, the protuberances of the hull are not formed by the local thickening of the outer layer but correspond to a hollow ornamentation of the shell.
3.2. Quantification of the Organic Matrix in the Shell
Matrix quantification of the extraction is shown in Table 1. Three shell batches were used, and the first one—used for proteomics—was subdivided in one and two bleaching steps. Batches two and three were bleached once. The second bleaching step affected mainly the insoluble matrix, which drastically collapsed. After one bleaching, we observed that the amount of soluble matrix is slightly higher than that of the insoluble one: (0.93 to 1.05 versus 0.73 to 0.85). In total, the matrix accounts for almost 1.8% of the shell weight. All three extractions give completely congruent results.
3.3. FT-IR Spectroscopy
FT-IR (ATR) spectra, acquired on both extracts of AIM and ASM fractions are summarized in Figure 4. The AIM2 extract was not analyzed due to a low amount of materials and was kept for further analyses. In the (2500–4000 cm–1) range, all samples exhibit one broad band around 3300 cm–1, usually assigned to the amide A group (ν(N−H)) [39]. A low amplitude enlarged band, around 2925 cm–1 is also observed, corresponding to ν(C−H) stretching vibrations.
The extracts show comparable spectra and a good similarity in the distribution of their absorption bands. All spectra clearly exhibit the presence of amide absorption bands at 1639 (ASM1-2)/1618 cm–1 (AIM1) and 1541 (ASM2)/1536 (ASM1)/1514 cm–1 (AIM1), respectively, assigned to the Amide I (ν(C=O)) and II (ν(C−N)) bands that characterize protein moieties. In addition, the spectra also express a high-intensity absorption band at 1026 (AIM2)/1029 (AIM1)/1031 cm−1 (AIM1) attributed to ν(C−O) stretching vibration and associated with the presence of saccharidic moieties. In both ASM and AIM extracts, a series of medium intensity bands are also present between 1450 and 1100 cm−1. Bands at 1414 cm–1 (ASM1-2) can be attributed to δ(C−H) scissoring vibration while those at 1223 (ASM2), 1224 (ASM1) and 1225 cm–1 (AIM1) are assigned to amide III vibrations (CN stretching, NH bending). Moreover, the weak bands at 1124 cm–1 (ASM1-2) associated to the absorptions pointed at 537 and 576 cm–1 (shoulders), suggest the presence of phosphate groups (PO43−) [40] and can be related to P–O stretching and O–P–O bending vibrations, respectively [41]. Note that ASM1 and ASM2 spectra are almost superimposable and exhibit the same distribution of absorption bands with similar intensities, with only slight shifts. In the [1700–900 cm−1] range, the AIM1 spectrum shows the same absorptions as the two ASMs but with different intensities. In the [900–450 cm−1] range, the AIM spectrum differs notably, showing in particularly a doublet at 778 and 763 cm−1 and a sharp band at 512 cm−1. On the basis of bibliographic data, such a fingerprint could correspond to ν(Si−O) stretching vibrations which are typically observed on the infrared spectrum of α-quartz [42].
3.4. Solid State Nuclear Magnetic Resonance
The 13C DE MAS NMR spectrum (Figure S1) of the cleaned shell sample (110 mg) shows the carbonate 168.5 ppm peak, hence confirming the polymorph identity of the shell as calcite only. Its ~1 ppm peak width (compared to 0.15 ppm in e.g., coccoliths [43]) suggests that the calcite lattice may be disrupted by occlusion of bioorganics and/or inorganics such as Mg2+ as is often found for biogenic calcite. The 13C CPMAS technique exposes only carbon species proximate to hydrogen atoms. Hence, the 13C CPMAS spectrum of the shell shows a strong and broadened (1.5 ppm) interfacial carbonates peak (Figure S2b) arising from carbonates which are proximate to bioorganic and water content, consistent with the broadened peak width seen in the DE MAS spectrum above and substantiating the effective incorporation of bioorganic matter within the calcitic matrix. The entire bioorganic content of the shell is straightforwardly seen in this CP MAS spectrum (Figure 5) showing contributions (broad resonance peaks) from proteinaceous and (oligo)saccharide content. Identification of the components comprising this content may be refined by examining separately the contributions from the acid-insoluble and acid-soluble fractions.
The 13C CP MAS NMR spectrum of the acid insoluble extract of Argonauta hians (AIM1, 20 mg; Figure 5d) exposes dominant proteinaceous content (~90%). The absence of pronounced peaks of oligosaccharides is inferred by comparison to the spectrum of chitin (Figure 5a and Figure S3d), a characteristic representative of polysaccharides implicated in biomineralization, so ruling out high oligosaccharides abundance in the AIM1 fraction. The pronounced amide peak centered at 170 ppm in this spectrum clearly substantiates the predominance of the proteinaceous content. The crowded aliphatic carbons region (15–80 ppm), including the alpha and most beta carbons, does not allow residue-by-residue assignment (Figure 5d). The resolved and less crowded aromatic region peaks (e.g., 129 ppm) suggest the occurrence of the aromatic amino acids (e.g., tyrosine) while the broad peak centered at 72 ppm may arise from either hydroxyprolines and/or polysaccharides. Different from A. hians, the bio-organic content of the AIM of the shell of S. spirula (Figure S3c)—another member of the cephalopod class—was shown as being dominated by chitin and possibly other oligosaccharides with only a minor proteinaceous content [28]. For comparison we also show the 13C CPMAS spectrum of the AIM of Arctica islandica (Figure S3b)—a bivalve whose shell acid insoluble matrix is protein-rich (~90:10 proteins versus saccharides) [29].
The 13C CPMAS spectrum of the acid soluble matrix (ASM1, lyophilized; Figure 5c) shows a different bioorganic composition than that seen for the AIM. While a similar proteinaceous content still appears, there is a notable contribution from oligosaccharide(s) component as seen by the broad peaks at identical and/or similar chemical shifts as of the chitin reference. As chitin is insoluble, these oligosaccharides may be attributed to chitosan or GAGs (vide infra) that additional to sulfates also possess the same N-acetyl sidechains as chitin and would potentially have similar CP MAS spectrum [44]. The excessive width of the peaks in this spectrum is primarily a result of the lyophilization step, which hampers the resolution, nevertheless exposes the gross content information.
Our 31P CP MAS NMR spectrum of the cleaned shell (Figure 6a) showed a notable peak centered at 3.5 ppm; as a phosphate peak is exhibited by the ASM fraction however absent in the AIM spectra (Figure 6a and 6c, respectively), this suggests the ASM contains organo-phosphate. Low molecular weight P-content (including Pi), if occurring in either fraction, would have been removed by the extraction procedures. We have previously reported similar 31P peaks for decalcified molluscs shells [29], and also, here we ascribe this peak to represent phosphorylation, most likely of tyrosine and/or serine side chains. Interestingly, while P-content in A. hians is present in the soluble matrix (ASM), in Spirula Spirula it was found in the insoluble matrix (AIM) [28].
3.5. Quantification of Total Sugars and Sulfated GAGs in the ASM
The quantification of total sugars and of sulfated glycosaminoglycans is shown in Table 2. The use of glucose and maltose for establishing the calibration curve indicates that the ASM contains between 7 and 12% (per weight) of total sugars, with all the rest being proteins. In addition, the colorimetric quantification of sulfated glycosaminoglycans indicates that these components are present in a similar percentage range (7 to 12%), which suggests that most of the saccharides of the ASM are actually sulfated GAGs.
3.6. SDS-PAGE of the Shell Matrix Extracts
The results obtained after migration of extracts are illustrated in Figure 7. On silver-stained gels, the ASM is characterized by a smear, a main sharp band at 19 kDa and a diffuse zone between 28 and 38 KDa, where at least two blurred bands can be distinguished but these are not individualized enough for establishing their exact apparent molecular weight. One guesses that two additional bands (symbolized by white arrows) are present at the bottom of the gel, the first one around 17 KDa and the second one, below. The top of the gel is more densely stained but without any apparent band. The Bio-Rad blue staining identifies a smear with the maximal staining around 34 KDa. The 19 KDa band is not stained at all, while the two ”bottom” bands can be distinguished. Carbocyanine dyes does not reveal any band but a smear, sepia in the top of the gel (until around 60 KDa) and bluish below 60 KDa, with a maximal intensity around 40–50 KDa. The top of the gel is characterized by a slimy purple stain (symbolized by a white star), always observed in our different attempts.
On silver-stained gels, the AIM electrophoretic profile resembles that of ASM, with a prominent band at 19 KDa, a smearing pattern along the whole lane and a denser staining between 30 and 35 KDa. A few differences are also observed: the top of the lane is densely stained dark brown around 170–180 KDa; two discrete bands are observed at 71 and 46 KDa, respectively. AIM stains poorly with Bio-Rad blue dye, and in a similar manner as the ASM. Finally, Stains-all evidences only a light pinkish smearing, more densely stained in the top of the gel while the migration front is stained brown.
At last, a few attempts with PAS (Periodic Acid Shiff) staining (not shown here) failed to emphasize the presence of any saccharide moieties. Only a blurred signal was obtained for ASM, at a very high molecular weight (>170 KDa).
3.7. In-Vitro Crystallization Assay
The effect of the ASM extract of A. hians on calcium carbonate crystallization was tested in the range (0.5–32 µg/well). Figure 8 shows only a few concentrations (1, 2, 4, 32 µg/well). Up to 1–2 µm/well, we do not detect any effect. From 4 to 32 µg/well, the main effect lies in the size reduction but the polycrystals remain unchanged in their shape (e.g., no rounded angles). One can observe that no significant difference can be noticed between ASM1 and ASM2. In general, the two soluble matrices exert weak effects, even at high concentrations.
3.8. Enzyme-Linked Immunosorbent Assay (ELISA)
Table 3 gives the cross-reactivity of the soluble extract 1 (ASM1) with a set of 17 polyclonal antibodies developed in our lab. These latter elicited against unfractionated or fractionated matrices, or against purified shell proteins, cover very different reactivity patterns, from narrow (anti-mucoperlin) to broad (K5087, K4952). Only one antibody cross-reacted with ASM1: that elicited against the P95 soluble protein of the nacreous layer of the freshwater mussel, Unio pictorum. This antibody was subsequently used for Western blotting and for immunogold staining.
3.9. Westernblot
Following the ELISA results, we performed a Western-blot of the two extracts (AIM1, ASM1), which were allowed to react with the anti-P95 antibody (1st and 3rd bleeding). The results are shown in Figure 9. A marked staining is evidenced in both extracts, with a higher intensity in the ASM. In both cases, the reactivity is characterized by a smear, which is more pronounced towards high molecular weights. None of the discrete bands observed in the SDS-PAGE are visible.
3.10. Immunogold Labeling
We performed immunogold with anti-P95 polyclonal antibody. The data are illustrated by Figure 10. In this test, bright white spots (approx. diameter 100 nm) localize gold/silver particles bound to the secondary antibodies that target the primary antibodies, which, in turn, target specific shell matrix proteins, the biochemical identity of which is still unknown. Figure 10A (left panel) shows that most of the signal is concentrated along the central core of the shell but some sparse spots are also observed on either calcitic side. The signal however decreases towards the external shell surfaces (not shown). In the calcitic fibrous layers, near the central core, the spot distribution is relatively homogeneous, i.e., does not exhibit any peculiar pattern, in relation to the microstructure (Figure 10B,F). The right panel (Figure 10C-E,G-I) corresponds to different negative control preparations, which are invariably unmarked.
3.11. Enzyme-Linked Lectin Assay (ELLA)
The results, condensed in Table 4, summarize the outcome of eight different experiments that produced similar reactivity patterns. Three categories of lectins were identified according to their reactivities to the ASM: Those which give positive but moderate reactivities (-++); enter this category DSL, Concanavalin A and WGA. Those that give weak reactivities (--+); they include SBA, PHA-L, SJA, succinylated WGA, GSL II, jacalin, LEL and STL. At last, those which are completely unreactive (---), including ten remaining lectins. Among the three lectins that exhibit the highest reactivities, DSL targets trimers, dimers and monomers of-acetylglucosamine, while concanavalin A is a mannose-binding lectin that targets N-linked glycoproteins; WGA has strong affinity with chitin oligomers, similarly to DSL. Strangely, in none of our eight experiments did we find a lectin that gave high reactivity, a phenomenon that we always observed with other shell extracts. In every case, we observed that the test developed slowly, a fact that persuaded us to increase the amount of matrix to use per well (from 200 ng to 900 ng), for obtaining lectin responses of higher amplitude. These experiments tend to show that the acetic acid-soluble matrix of A. hians is rather poor in sugar moieties.
3.12. Lectingold Labeling
The results of the lectin gold labeling are shown in Figure 11. The left panel (Figure 11A) is a general view of the shell cross-section, marked by the central organic layer. The central panel corresponds to a magnification of the upper and lower layers (Figure 11B,F), and the right one (Figure 11C–E,G–I), to different negative controls (respectively, from top to bottom, without ConA, without GABIO, and an absolute blank). Because the spots are tiny (approx. 100 nm), we have indicated the position of few of them by black arrows. The labeling is not continuous—i.e., the spots are not aligned with the depositional surfaces of the calcite fibers—but rather disperse among the fibers. We observed that the labeling tends to be more pronounced aside the central core than at the periphery of the shell wall. None of the negative controls exhibit such a signal.
3.13. Proteomic Analysis
The proteomics results are shown in Table 5 and Table 6. They summarize the MASCOT searches performed in “trypsin” and ”semi-trypsin” modes. Table 5 lists all the peptides identified per extract—these peptides range from seven amino acid residues long to 21—and depicts the number of shared peptides between extracts when compared two by two. Table 6 represents the major and most significant protein hits, corresponding to proteins covered at more than 5% of their sequences. We have chosen not to show the hits corresponding to proteins covered at less than 5%. However, a complete version of Table 6 is accessible in the supplementary data (Table S2): it includes all the protein hits, the full sequences of the corresponding proteins and some chemical characteristics of their primary structure (number of amino acids, molecular weight, isoelectric point, number of negatively and positively charged amino acid residues).
Table 5A shows that the four extracts are not similarly covered: AIM1 comprises only 27 peptides in trypsin mode and 50 in semi-trypsin mode. For AIM2, these numbers are 57 and 77, respectively, 76 and 99 for ASM1, and, at last, 65 and 83 for ASM2. In term of peptide compositions, the four extracts overlap partially in trypsin mode: the highest overlap is obtained between ASM1 and ASM2 (50%), and the lowest, between AIM1 and ASM2 (20%) (Table 5B). In semi-trypsin mode, these percentages are kept identical.
Table 6 shows that several proteins of heterogeneous families are represented: among the most prominent are a few histones, but also cytoskeletal proteins (actin, tubulin, tropomyosin), transcriptional regulator ATRX, ubiquitin, 14-3-3 proteins, i.e., proteins that bind to signaling molecules. One RNA helicase, one elongation factor, one sarcoplasmic calcium-binding protein are also present, in addition to few uncharacterized proteins from Octopus or from Spirula, the function of which is unknown. A few chaperones, i.e., proteins that help folding of other proteins, are also represented, such as one protein disulfide isomerase and one endoplasmin-like. Note the presence of a potassium channel toxin. Among the protein hits not listed in Table 6 because of low coverage, one can notice the presence of calreticulin, calsyntenin, heat shock proteins and other members but the significance of this hits is unclear.
The number of hits that are specific to shell proteins is singularly low (see Table S2): in the hits obtained in semi-trypsin mode, we identified in the two insoluble extracts one peptide of shematrin-like 2 protein from Pinctada margaritifera, while three extracts (AIM2, ASM1, SM2) exhibit one peptide of nautilin-63, a shell protein from Nautilus macromphalus. Proteins with biased amino acid compositions are notably absent: almost none of the peptides from Table 6 exhibit biased amino acid sequences.
4. Discussion
In the present study, we have investigated the physical and biochemical properties of the argonaut shell. This biomineralized structure—in reality a calcified eggcase—appears as an oddity of the argonautid family since it is secreted by the first pair of dorsal arms of females only and made of calcite, in marked contrast to any other mollusc shells. Our study focuses more precisely on the cosmopolitan—worldwide distributed—species, Argonauta hians, the winged argonaut, also defined as the muddy argonaut, or the brown paper nautilus.
4.1. Microstructure
From a microstructural viewpoint, the shell of Argonauta hians, like the shell of other species, consists of a central organic layer sandwiched between two layers of calcitic fibers. This general organization of the shell structure was previously described by several authors [19,21,45,46] on neighboring species. So far, to our knowledge, the most complete study is that of Mitchell et al. [19], who defined the peripheral layers as “prismatic calcite”. Here, we prefer the use of “fibrous calcite”. In spite of this difference, our observations corroborate theirs, namely, that at the periphery of the central core, the spherulites give birth to calcitic needles that gradually become parallel to each other; that both calcitic layers exhibit a variability in their thickness along the coiling and that depositional accidents, characterized by the re-initialization of mineralization (from a spherulite to diverging fibers) occur from time to time in the peripheral layers. However, Mitchell et al. [19] argue that the central core is mainly composed of mineral grains; they do not evoke any organic material in this layer, contrarily to Kobayashi [46]. In view of our SEM observation in back-scattered mode and of the intense labeling of the central layer by both antibody (anti-P95) and lectin (concanavalin A) labeling, we follow the assumption of Kobayashi, i.e., that the central layer: ”includes organic matrixes... The matrixes seem to be composed of protein, neutral mucopolysaccharides and mucopolysaccharide”.
Considering the microstructural organization of the shell (core sandwiched between two fibrous layers) and the fact that, from either side of the core, spherulites grow in opposite directions, one logically concludes that the core layer is the starting point of the shell fabrication. Given that the two peripheral layers are microstructurally identical, we may infer that they are produced by a similar depositional mechanism. Mitchell et al. [19] proposed the following secretory chronology: first, the two dorsal webs (located on the distal ends of the female’s first dorsal arm pair) join together and seal the space where spherulite mineralization occurs; one of the two webs playing a template role. According to these authors: “the crystallites at the edges of the central layer initially show a spherulitic growth pattern and then extend into prisms due to the restriction in growth directions created by the presence of neighbouring spherulites. Since only those crystallites which are oriented perpendicular to the central zone have room for unrestricted growth, there is very good alignment between the resultant prismatic crystals”. Secondly, at a later stage, they suggest that the web positions alternate between the exterior and the interior of the shell. Thus, the shell growth appears to be periodical. The two main arguments for this hypothesis lie in the fact that living specimens were observed with their webs retracted into the shell [47,48] and also in the occurrence of mineralization accidents. For example, these accidents may be explained by the deposition of impurities on the last formed shell surface on the outer layer when the web is retracted into the shell (and vice-versa). We do not find any opposite argument; however, considering the dorsal extremity of the shell (Figure 3C,D) and its microstructural organization, it appears that the physiological mechanism is not as binary but may be more sophisticated and gradual. The bevel observed in the extremity (Figure 3D) may be explained by Mitchell’s model. However, at a later stage, the deposited layers that appear continuous from outside to inside without any discontinuity, and which envelop the subjacent structures, cannot be explained by a simple switch in web position. We propose that, at this formation stage, a new mechanism occurs: the web progressively migrates from the exterior to the interior of the shell, producing a continuous layer that terminates the shell synthesis.
4.2. Shell Biochemistry
Besides being a Nature’s oddity, the argonaut shell has been the focus of only two old biochemical characterizations: Turek [49] found a high quantity of organic substances, without indicating the nature of the organics. Degens and coworkers [50] analyzed the amino acid composition of the hydrochloric acid-insoluble matrix and obtained a composition enriched in glycine, serine and aspartic acid residues. They also detected the two most standard amino sugars, glucosamine and galactosamine. In our hands, the extraction of both soluble and insoluble matrices yielded relatively large amount of materials, around 1.8% of the shell weight. This classifies the Argonauta hians eggcase among the organic-rich shells. Curiously, the amount of acetic acid-soluble matrix is slightly higher (1.1 to 1.44 times) than that of the insoluble fraction, a rather unusual proportion in molluscan shells: indeed, shell microstructures of organic-rich shells such as nacre or prisms are usually constituted of insoluble materials that can represent up to 90–95% of the whole organic matrix and above 1% of the shell weight [51]. At the opposite, organic-poor shell microstructures, i.e., crossed-lamellar, are mostly constituted of soluble materials that represents, at best, 0.1% of the shell weight. Another interesting point is that the A. hians shell matrix seems to be mostly proteinaceous, as deduced from SSNMR (AIM) or from the ELLA assay (ASM), which is another peculiarity of this matrix. Our finding is in agreement with the old data of Degens and coworkers who obtained a protein/amino sugars ratio of 108, from the HCl-insoluble matrix of A. hians. The sugar moieties represent about 7–10% of the ASM, while the AIM seems devoid of chitin. It is remarkable to note that the shell matrix of A. hians is consequently very different from that of other cephalopods, such as the Ram’s horn squid Spirula spirula ([28], see also Table S2) or the cuttlefish Sepia officinalis [52], both being particularly enriched in chitin. The last interesting point about saccharide moieties is that most of them identified in the ASM are sulfated glycosaminoglycans (GAGs). Because of their net negative charge, GAGs are usually known to interact strongly with the in vitro precipitation of calcium carbonate. In our test, the ASM did not exhibit such effect and was found to be poorly reactive (in our in vitro crystallization assay), in spite of being associated to calcite.
4.3. Proteomics on the Shell Matrix
Finally, in order to obtain a more precise idea of the proteins that constitute the shell matrix of A. hians, we performed proteomics. As there is not yet any transcriptomic data to lean on for this species in particular, and for argonautids in general, the information provided by proteomics is partial and consists mainly in peptide lists, rather than full protein sequences. In addition to these limitations, proteomics can be flawed by two series of factors: firstly, the intrinsic properties of the matrix proteins, secondly, analytical bias. The first ones include the complexity of the matrix (several different proteins and sugars), extensive cross-linking, numerous post-translational modifications and finally, the presence of long sequences of low complexity that cannot be easily digested, i.e., analyzed accurately by tandem mass spectrometry. The second ones include the cleaning procedure, the digestion with a single enzyme (most of the time, trypsin) and the use of a qualitative analysis (based on presence /absence), instead of a quantitative one.
In spite of these bottlenecks, we were able to present, for the first time, a peptidic fingerprint of four fractions, soluble or insoluble, obtained after one or two bleaching steps, of the shell matrix of A. hians. It is interesting to observe that the four fractions share a number of peptides, which means that their peptide compositions partly overlap. This is especially true for the two ASMs, but AIM2 also has a lot in common with these two fractions. This finding is in agreement with some of our previous data acquired on other mollusc shells (such as the freshwater mussel Unio pictorum), namely that the soluble and insoluble matrices resemble each other more than what old mollusc shell mineralization models used to predict [53].
The protein identification was performed according to two modes, “trypsin”, and ”semi-trypsin”. The second mode brings additional hits, which have to be taken more cautiously but are congruent with those obtained in trypsin mode. Among the most prominent hits, one finds histones. Histones are very basic proteins associated to DNA in the nucleus. Their presence in an extracellular matrix may appear odd, at first sight. However, it is known that histones or histone-derived peptides can function extracellularly as antimicrobial agents. It has been repeatedly shown that the calcifying matrix in metazoans contains such peptides: the eggshell matrix [54], molluscs [28,55]. In the case of argonautids, one can infer that antimicrobial peptides are fully necessary since the process of shell mineralization requires the webs to move from outside to inside of the shell and vice-versa [19]. Under these conditions, the mineralization front is periodically uncovered, and thus, exposed to bacterial infection. Another putative candidate for such defensive mechanism, may include a potassium channel toxin, well-covered in the AIM1 fraction. In a previous paper, we also identified a toxin in the skeletal matrix of the colonial coral Acropora millepora [56] and we suppose that these toxins play similar protective functions in these two very different calcifiers.
Cytoskeletal proteins (actin, tropomyosin, tubulin) are, strangely, also well represented. We cannot exclude that they are contaminants, in spite of the thorough cleaning procedure with bleach. We cannot rule out that a subtle link exists between cytoskeletal proteins and the extracellular matrix; several evidences show it, in particular when vesicles are involved in mineralization process. For example, Weiss and coworkers have nicely demonstrated the tight “physical link” between the cytoskeletal forces and the extracellular shell-forming matrix [57] in marine mussels.
Other proteins represented in the analysis include a few enzymes and signaling molecules. Among the enzymes of interest, one finds heparan sulfate sulfotransferase, a protein disulfide isomerase, glyceraldehyde 3-phosphate dehydrogenase 2 and a translocase. Heparan sulfate sulfotransferases are involved in the biosynthesis of sulfated glycosaminoglycans (GAGs), and the presence of one member of this enzyme family is congruent with the occurence of GAGs in the matrix. Protein disulfide isomerases are involved in the correct folding of extracellular matrix proteins and play a role similar to that of chaperones. The function of the two other enzymes is more elusive. Among the signaling proteins, one recognizes 14-3-3 protein and Wnt. The first one was already found in the shell matrix of Spirula spirula [28]. Cell signaling is an important function in many—if not all—extracellular matrices involved in calcification [58].
Some molecular functions that are commonly found in most shell matrices, shine by their absence in our analysis. We did not detect proteins that are associated to chitin metabolism: they include a set of enzymes (chitobiase, chitinase, etc.) and non-enzyme chitin-binding proteins which play a structural role by being constructional elements of the three-dimensional scaffold. Their absence is not really surprising as we did not detect in any manner the presence of chitin in the shell of A. hians. More surprising is the absence of "classical" enzymes like carbonic anhydrase or tyrosinase, that play functions in bicarbonate conversion and in quinone-tanning (cross-linking) processes, respectively. Their absence in our dataset cannot be easily explained, unless they belong to the fraction of the skeletal matrix, not occluded in the shell during mineralization [59]. However, let us mention the presence of a putative thioredoxin peroxidase in AIM2 fraction, covered at 3.6%. Peroxidase are often found in numerous calcifying extracellular matrices and they may be involved in cross-linking too [60], in addition to playing numerous other functions. At last, the absence of proteins that exhibit low complexity domains—also defined as compositionally-biased regions—is puzzling. Firstly, in the list of identified peptides (Table 5), only a limited number of them exhibit biased compositions (such as alanine-rich, aspartic acid-rich or serine-rich) but most of them exhibit sequences with no remarkable composition. Secondly, we did not find hits for shell proteins that have low complexity domain sequences characteristics, such as nacrein, glycine-rich proteins, aspein, MSP-1 (matrix soluble protein-1) or related members. Only one sequence matches with a shematrin, but not in the low complexity region, and the coverage is too low to assess the effective presence of a member of this protein family in the extracts. All these "missing molecular functions" do not mean that the corresponding proteins are not there in the shell matrix. They may somehow be “masked” for the reasons given above (no trypsic cleavage or other technical biases). This underpins the necessity of constructing one or more transcriptomes of the webs of this non-model organism to bring conclusive evidences on the dissimilarity of the shell matrix of Argonauta hians with that of better-known models.
4.4. Evolutionary Considerations
Our data (both physical, biochemical and molecular) indicate that Argonauta hians has a peculiar shell. This calcified structure is not homologous to a standard molluscan shell, since its synthesis is not performed by the “classical” molluscan calcifying organ, i.e., the mantle, but by the webs of the first dorsal arm pair. Its entirely calcitic nature puts it apart from all other calcifying cephalopods. Even though the microstructural organization—an organic layer sandwiched between two identical mineral layers—is reminiscent of the Ram’s Horn squid shell wall (Spirula spirula), the mode of construction (in particular, the secretory events and their physiology) appears completely different. Indeed, in Argonauta (contrarily to Spirula), the shell is external and lacks a periostracal layer (utilized for sealing the space dedicated to mineralization and as the first template for mineral deposition), which implies obviously different physiological constraints. To date, the single hypothesis proposed suggests that the arms secrete the central organic layer first, which functions as template for the deposition of the two peripheral layers. This is only possible by the switching movement of the webs from the outside to the inside of the shell [19], a physiological process unique among molluscs.
Concerning the proteomic data, we find a few shared peptides (in total, 14) with the Spirula’s shell matrix [28], but no matches with the already published peptides of the cuttlefish Sepia officinalis [61,62] and of the nautilus Nautilus macromphalus [53]. This is not really surprising: although the Ram’s Horn squid and the cuttlefish are the mineralizing cephalopods that are phylogenetically the closest to Argonauta, the divergence time between the "Sepia-Spirula" clade (Decabrachia) and argonautids (Octobrachia) is deep, and may have occurred in the Permian [11,63]. By enlarging the circle to other molluscan classes for which shell proteomic data are available (gastropods, bivalves), we found hardly any similarity in term of peptide fingerprint. All these proteomic data suggest strongly—but do not demonstrate firmly—that the matrix of A. hians does not resemble that of other molluscs for which proteomic data are available.
This partial finding is substantiated by two complementary biochemical results: the absence of chitin and the ELISA signal. The lack of chitin in the shell matrix clearly separates A. hians from the cuttlefish [50] and the Ram’s horn squid [28] and, to a lesser extent, from the nautilus [50]. Furthermore, it seems that an important proportion of the saccharides in A. hians are sulfated GAGs. ELISA data constitute another strong argument: with one exception, no cross-reactivity of the ASM of A. hians was recorded with a large set of polyclonal antibodies, some of which exhibiting a high level of cross-reactivity with several skeletal matrices of different classes or even phylums [64]. This suggests once more—but does not prove yet—that the shell matrix of A. hians is very peculiar and unique. From an evolutionary viewpoint, this means that the "molecular tools" (i.e., the proteins) used for the construction of the argonaut’s shell are not inherited from one cephalopod shell-forming ancestor. Although these functions may be ancient (or not), their recruitment and orchestration for mineralizing the argonaut shell seems to be specific of this clade and not seen elsewhere. Our conclusions will, however, be better substantiated when one or more transcriptomes of the argonaut’s mineralizing arms are available.
Supplementary Materials
The following are available online at https://www.mdpi.com/2073-4352/10/9/839/s1. Figure S1. 75.4 MHz 13C DE MAS NMR spectrum (black) of the cleaned shell powder of A. hians (110 mg; 30 scans) and of 13C-enriched coccoliths (red) [43] superimposed for comparison. The spectra were obtained by acquiring transients with repetition delay of 40 min (close to fully relaxed). Figure S2. 75.4 MHz 13C CPMAS spectra of (a) of α-chitin standard (shrimp), (b) the cleaned shell of Argonauta hians, and of its extracts (c) acid soluble and (d) acid insoluble matrices (AIM1 and ASM1). The spectra are the same as in Figure 5 except the non-expanded spectrum of the cleaned shell that demonstrates the strong peak of interfacial carbonates. Figure S3. 75.4 MHz 13C CPMAS spectra of acid insoluble shell extracts (AIM1) of a) Argonauta hians, compared to other insoluble shell matrices: b) Arctica islandica, c) Spirula spirula, and d) α-chitin standard (shrimp). The comparison shows that the organic content of A. hians consists primarily of proteinaceous matter while (oligo) saccharides, if present, comprise no more than 10% of the shell matrix. Table S1. List of the antibodies used for the ELISA test. Their target antigens are indicated, as well as their respective dilution of use (titers). Table S2. Complete protein hits obtained by proteomics, according to two stringencies: trypsin (T), and semi-trypsin (ST). For each protein hit, the presence is indicated by "x", as well as the protein coverage (Cov.) and the number of peptides (Pep.) that allow the protein identification, for each of the four extracts. For each sequence, the signal peptide is indicated in red and italic. Protein hits above 10% coverage are in green; hits with coverage between 5 and 10% are in blue, and those below 5% are in orange.
Author Contributions
Conceptualization, M.O. and F.M.; methodology, M.O. and F.M.; validation, M.O. and F.M.; formal analysis, M.O.; F.M.; C.B., L.P.; A.S. and I.B.S.; investigation, M.O., F.M., L.P., A.S. and I.B.S.; data curation, F.M.; writing—original draft preparation, M.O. and F.M.; writing—review and editing, M.O.; F.M.; A.S., I.B.S, C.B., L.P., P.N.; visualization, M.O.; supervision, F.M.; project administration, F.M.; P.N.; funding acquisition, F.M. All authors have read and agreed to the published version of the manuscript.
Funding
This work was financially supported by a grant from INSU–CNRS (INTERRVIE program, 2019) and by annual recurrent budget from UMR CNRS 6282. The contribution of I. Ben Shir and A. Schmidt was supported by the Israel Science Foundation grant 2001/17.
Acknowledgments
The authors thank Kevin Stevens (Ruhr-Universität Bochum, Bochum, Germany) for providing one shell of Argonauta argo and Jan Strugnell (James Cook University, Townsville, Australia) for providing the Spirula spirula molecular dataset. They also thank Jérôme Thomas (UMR CNRS 6282 Biogéosciences Dijon) for designing Figure 1.
Conflicts of Interest
The authors declare no conflict of interest. The funders had no role in the design of the study; in the collection, analyses, or interpretation of data; in the writing of the manuscript, or in the decision to publish the results.
References
- Lowenstam, H.A.; Weiner, S. On Biomineralization; Oxford University Press: Oxford, UK, 1989. [Google Scholar]
- Addadi, L.; Joester, D.; Nudelman, F.; Weiner, S. Mollusk shell formation: A source of new concepts for understanding biomineralization processes. Chem. A Eur. J. 2006, 12, 980–987. [Google Scholar] [CrossRef]
- Simkiss, K.; Wilbur, K.M. Biomineralization: Cell Biology and Mineral Deposition; Elsevier, Ed.; Academic Press: San Diego, CA, USA, 1989. [Google Scholar]
- Hare, P.E. Amino acids in the proteins from aragonite and calcite in the shells of mytilus californianus. Science 1963, 139, 216–217. [Google Scholar] [CrossRef] [PubMed]
- Crenshaw, M.A. The soluble matrix from Mercenaria mercenaria shell. Biomineralization 1972, 6, 6–11. [Google Scholar]
- Weiner, S. Mollusk shell formation: Isolation of two organic matrix proteins associated with calcite deposition in the bivalve Mytilus californianus. Biochemistry 1983, 22, 4139–4145. [Google Scholar] [CrossRef]
- Rusenko, K.W.; Donachy, J.E.; Wheeler, A.P. Purification and characterization of a shell matrix phosphoprotein from the american oyster. In Surface Reactive Peptides and Polymers; Sykes, C.S., Wheeler, A.P., Eds.; ACS Symposium Series; American Chemical Society (ACS): Washington, DC, USA, 1991; Volume 444, pp. 107–124. [Google Scholar]
- Marin, F.; Luquet, G. Molluscan shell proteins. Comptes Rendus Palevol 2004, 3, 469–492. [Google Scholar] [CrossRef]
- Sarashina, I.; Yamaguchi, H.; Haga, T.; Iijima, M.; Chiba, S.; Endo, K. Molecular evolution and functionally important structures of molluscan dermatopontin: Implications for the origins of molluscan shell matrix proteins. J. Mol. Evol. 2006, 62, 307–318. [Google Scholar] [CrossRef]
- Nishiguchi, M.K.; Mapes, R.H. Cephalopoda. In Phylogeny and Evolution of the Mollusca; Ponder, W.F., Lindberg, D.R., Eds.; University of California Press: Berkeley, CA, USA, 2008; pp. 163–199. [Google Scholar]
- Kröger, B.; Vinther, J.; Fuchs, D. Cephalopod origin and evolution: A congruent picture emerging from fossils, development and molecules. BioEssays 2011, 33, 602–613. [Google Scholar] [CrossRef]
- Brayard, A.; Escarguel, G.; Bucher, H.; Monnet, C.; Brühwiler, T.; Goudemand, N.; Galfetti, T.; Guex, J.; Meehl, G.A.; Arblaster, J.M.; et al. Good genes and good luck: Ammonoid diversity and the end-permian mass extinction. Science 2009, 325, 1118–1121. [Google Scholar] [CrossRef] [Green Version]
- Murray, J.W. Atlas of Invertebrate Macrofossils; Longman & The Palaeontological Association: Harlow, UK, 1985. [Google Scholar]
- Finn, J.K. Family argonautidae. In Cephalopods of the World. An Annotated and Illustrated Catalogue of Cephalopod Species Known to Date; Octopods and Vampire Squids. FAO Species Catalogue for Fishery Purposes; Jereb, P., Roper, C.F., Norman, M.D., Finn, J.K., Eds.; FAO Species Catalogue for Fishery Purposes: Rome, Italy, 2014; Volume 3, pp. 228–237. [Google Scholar]
- Finn, J.K.; Victoria, M. Recognising variability in the shells of argonauts (Cephalopoda: Argonautidae): The key to resolving the taxonomy of the family. Mem. Mus. Vic. 2018, 77, 63–104. [Google Scholar] [CrossRef]
- Finn, J.K.; Norman, M.D. The argonaut shell: Gas-mediated buoyancy control in a pelagic octopus. Proc. R. Soc. B Biol. Sci. 2010, 277, 2967–2971. [Google Scholar] [CrossRef] [Green Version]
- Naef, A. Cephalopoda. Fauna Flora Golf. Neapel 1923, 35, 1–863. [Google Scholar]
- Kniprath, E. Ontogeny of the molluscan shell field: A review. Zool. Scr. 1981, 10, 61–79. [Google Scholar] [CrossRef]
- Mitchell, P.R.; Phakey, P.P.; Rachinger, W.A. Ultrastructural observations of the argonaut shell. Scan. Microsc. 1994, 8, 35–46. [Google Scholar]
- Bandel, K.; Dullo, W.C. Zur Schalenstruktur fossiler und rezenter Argonauta-Gehause (Octopoda, Cephalopoda). Nat. Mensch Jahresmitt. Nat. Ges. Nurnb. 1984, 1984, 33–38. [Google Scholar]
- Wolfe, K.; Smith, A.M.; Trimby, P.; Byrne, M. Microstructure of the paper nautilus (Argonauta nodosa) shell and the novel application of electron backscatter diffraction (EBSD) to address effects of ocean acidification. Mar. Biol. 2012, 160, 2271–2278. [Google Scholar] [CrossRef]
- Marie, B.; Luquet, G.; De Barros, J.-P.P.; Guichard, N.; Morel, S.; Alcaraz, G.; Bollache, L.; Marin, F. The shell matrix of the freshwater mussel Unio pictorum (Paleoheterodonta, Unionoida). FEBS J. 2007, 274, 2933–2945. [Google Scholar] [CrossRef]
- Dubois, M.; Gilles, K.; Hamilton, J.K.; Rebers, P.A.; Smith, F.; Dubois, K.G.M. A colorimetric method for the determination of sugars. Nature 1951, 168, 167. [Google Scholar] [CrossRef]
- Dubois, M.; Gilles, K.A.; Hamilton, J.K.; Rebers, P.A.; Smith, F. Colorimetric method for determination of sugars and related substances. Anal. Chem. 1956, 28, 350–356. [Google Scholar] [CrossRef]
- Masuko, T.; Minami, A.; Iwasaki, N.; Majima, T.; Nishimura, S.-I.; Lee, Y.C. Carbohydrate analysis by a phenol-sulfuric acid method in microplate format. Anal. Biochem. 2005, 339, 69–72. [Google Scholar] [CrossRef]
- Morrissey, J.H. Silver stain for proteins in polyacrylamide gels: A modified procedure with enhanced uniform sensitivity. Anal. Biochem. 1981, 117, 307–310. [Google Scholar] [CrossRef]
- Campbell, K.P.; MacLennan, D.H.; Jorgensen, A.O. Staining of the Ca2+-binding proteins, calsequestrin, calmodulin, troponin C, and S-100, with the cationic carbocyanine dye “Stains-all”. J. Biol. Chem. 1983, 258, 11267–11273. [Google Scholar] [PubMed]
- Oudot, M.; Neige, P.; Ben, S.I.; Schmidt, A.; Strugnell, J.M.; Plasseraud, L.; Broussard, C.; Hoffmann, R.; Lukeneder, A.; Marin, F. The shell matrix and microstructure of the Ram’s Horn squid: Molecular and structural characterization. J. Struct. Biol. 2020, 211, 107507. [Google Scholar] [CrossRef] [PubMed]
- Agbaje, O.B.A.; Ben, S.I.; Zax, D.B.; Schmidt, A.; Jacob, D.E. Biomacromolecules within bivalve shells: Is chitin abundant? Acta Biomater. 2018, 80, 176–187. [Google Scholar] [CrossRef] [PubMed]
- Stejskal, E.; Schaefer, J.; Waugh, J. Magic-angle spinning and polarization transfer in proton-enhanced NMR. J. Magn. Reson. 1977, 28, 105–112. [Google Scholar] [CrossRef]
- Bennett, A.E.; Rienstra, C.M.; Auger, M.; Lakshmi, K.; Griffin, R.G. Heteronuclear decoupling in rotating solids. J. Chem. Phys. 1995, 103, 6951–6958. [Google Scholar] [CrossRef]
- Albeck, S.; Aizenberg, J.; Addadi, L.; Weiner, S. Interactions of various skeletal intracrystalline components with calcite crystals. J. Am. Chem. Soc. 1993, 115, 11691–11697. [Google Scholar] [CrossRef]
- Pavat, C.; Zanella-Cleon, I.; Becchi, M.; Medakovic, D.; Luquet, G.; Guichard, N.; Alcaraz, G.; Dommergues, J.-L.; Serpentini, A.; Lebel, J.-M.; et al. The shell matrix of the pulmonate land snail Helix aspersa maxima. Comp. Biochem. Physiol. Part B Biochem. Mol. Biol. 2012, 161, 303–314. [Google Scholar] [CrossRef]
- Matsudaira, P. Sequence from picomole quantities of proteins electroblotted onto polyvinylidene difluoride membranes. J. Biol. Chem. 1987, 262, 10035–10038. [Google Scholar]
- Marie, B.; Luquet, G.; Bédouet, L.; Milet, C.; Guichard, N.; Medakovic, D.; Marin, F. Nacre calcification in the freshwater mussel unio pictorum: Carbonic anhydrase activity and purification of a 95 kDa calcium-binding glycoprotein. ChemBioChem 2008, 9, 2515–2523. [Google Scholar] [CrossRef]
- Marin, F.; Pokroy, B.; Luquet, G.; Layrolle, P.; De Groot, K. Protein mapping of calcium carbonate biominerals by immunogold. Biomaterials 2007, 28, 2368–2377. [Google Scholar] [CrossRef]
- Kanold, J.M.; Guichard, N.; Immel, F.; Plasseraud, L.; Corneillat, M.; Alcaraz, G.; Brümmer, F.; Marin, F. Spine and test skeletal matrices of the Mediterranean sea urchin Arbacia lixula a comparative characterization of their sugar signature. FEBS J. 2015, 282, 1891–1905. [Google Scholar] [CrossRef] [PubMed]
- Loftus, E.; Rogers, K.; Lee-Thorp, J. A simple method to establish calcite: Aragonite ratios in archaeological mollusc shells. J. Quat. Sci. 2015, 30, 731–735. [Google Scholar] [CrossRef]
- Kong, J.; Yu, S. Fourier transform infrared spectroscopic analysis of protein secondary structures. Acta Biochim. Biophys. Sin. 2007, 39, 549–559. [Google Scholar] [CrossRef] [PubMed] [Green Version]
- Radev, L.; Mostafa, N.Y.; Michailova, I.; Salvado, I.M.M.; Fernandes, M.H.V. In vitro bioactivity of collagen/calcium phosphate silicate composites, cross-linked with chondroitin sulfate. Int. J. Mater. Chem. 2012, 2, 1–9. [Google Scholar] [CrossRef] [Green Version]
- Jastrzebski, W.; Sitarz, M.; Rokita, M.; Bułat, K. Infrared spectroscopy of different phosphates structures. Spectrochim. Acta Part A Mol. Biomol. Spectrosc. 2011, 79, 722–727. [Google Scholar] [CrossRef]
- Anbalagan, G.; Prabakaran, A.R.; Gunasekaran, S. Spectroscopic characterization of Indian standard sand. J. Appl. Spectrosc. 2010, 77, 86–94. [Google Scholar] [CrossRef]
- Gertman, R.; Ben, S.I.; Kababya, S.; Schmidt, A. In situ observation of the internal structure and composition of biomineralized emiliania huxleyi calcite by solid-state NMR spectroscopy. J. Am. Chem. Soc. 2008, 130, 13425–13432. [Google Scholar] [CrossRef]
- Pomin, V.H. NMR chemical shifts in structural biology of glycosaminoglycans. Anal. Chem. 2013, 86, 65–94. [Google Scholar] [CrossRef]
- Bøggild, O.B. The shell structure of the mollusks. K. Dan. Vidensk. Selsk. Skr. Naturvidensk. Math. Afd. 1930, 9, 231–326. [Google Scholar]
- Kobayashi, I. Internal microstructure of the shell of argonauta argo. Venus 1971, 30, 103–112. [Google Scholar] [CrossRef]
- Young, J.Z. Observations on argonauta and especially its method of feeding. J. Zool. 2009, 133, 471–479. [Google Scholar] [CrossRef]
- Stephens, W.M. The exquisite argonauts. Sea Front. 1965, 11, 139–147. [Google Scholar]
- Turek, R. Chemisch-analytische untersuchungen an mollusken-schalen. Arch. für Nat. Z. für Syst. Zool. 1933, 2, 291–302. [Google Scholar]
- Degens, E.T.; Spencer, D.W.; Parker, R.H. Paleobiochemistry of molluscan shell proteins. Comp. Biochem. Physiol. 1967, 20, 553–579. [Google Scholar] [CrossRef]
- Marin, F.; Marie, B.; Hamada, S.B.; Silva, P.; Roy, N.L.; Wolf, S.E.; Montagnani, C.; Joubert, C.; Piquemal, D.; Marie, B. “Shellome”: Proteins involved in mollusc shell biomineralization—Diversity, functions. In Recent Advances in Pearl Research; TERRAPUB: Tokyo, Japan, 2013; pp. 149–166. [Google Scholar]
- Dauphin, Y.; Marin, F. The compositional analysis of recent cephalopod shell carbohydrates by Fourier transform infrared spectrometry and high performance anion exchange-pulsed amperometric detection. Cell. Mol. Life Sci. 1995, 51, 278–283. [Google Scholar] [CrossRef]
- Marie, B.; Marin, F.; Marie, A.; Bédouet, L.; Dubost, L.; Alcaraz, G.; Milet, C.; Luquet, G. Evolution of nacre: Biochemistry and proteomics of the shell organic matrix of the cephalopod nautilus macromphalus. ChemBioChem 2009, 10, 1495–1506. [Google Scholar] [CrossRef]
- Réhault-Godbert, S.; Hervé-Grépinet, V.; Gautron, J.; Cabau, C.; Nys, Y.; Hincke, M. Molecules involved in chemical defence of the chicken egg. In Improving the Safety and Quality of Eggs and Egg Products: Egg Chemistry, Production and Consumption; Nys, Y., Bain, M., Van Immerseel, F., Eds.; Woodhead Publishing: Cambridge, UK, 2011; pp. 183–208. [Google Scholar]
- Sathyan, N.; Philip, R.; Chaithanya, E.R.; Kumar, P.R.A. Identification and molecular characterization of molluskin, a histone-H2A-derived antimicrobial peptide from molluscs. ISRN Mol. Biol. 2012, 2012, 219656. [Google Scholar] [CrossRef] [Green Version]
- Ramos-Silva, P.; Kaandorp, J.A.; Huisman, L.; Marie, B.; Zanella-Cléon, I.; Guichard, N.; Miller, D.J.; Marin, F. The skeletal proteome of the coral acropora millepora: The evolution of calcification by co-option and domain shuffling. Mol. Biol. Evol. 2013, 30, 2099–2112. [Google Scholar] [CrossRef]
- Weiss, I.M.; Schönitzer, V.; Eichner, N.; Sumper, M. The chitin synthase involved in marine bivalve mollusk shell formation contains a myosin domain. FEBS Lett. 2006, 580, 1846–1852. [Google Scholar] [CrossRef] [Green Version]
- Marin, F. Mollusc shellomes: Past, present and future. J. Struct. Biol. 2020, 212, 107583. [Google Scholar] [CrossRef]
- Marin, F.; Bundeleva, I.A.; Takeuchi, T.; Immel, F.; Medakovic, D. Organic matrices in metazoan calcium carbonate skeletons: Composition, functions, evolution. J. Struct. Biol. 2016, 196, 98–106. [Google Scholar] [CrossRef] [PubMed]
- Herlitze, I.; Marie, B.; Marin, F.; Jackson, D.J. Molecular modularity and asymmetry of the molluscan mantle revealed by a gene expression atlas. GigaScience 2018, 7, 1–16. [Google Scholar] [CrossRef] [PubMed] [Green Version]
- Le Pabic, C.; Marie, A.; Marie, B.; Percot, A.; Bonnaud-Ponticelli, L.; Lopez, P.-J.; Luquet, G. First proteomic analyses of the dorsal and ventral parts of the Sepia officinalis cuttlebone. J. Proteom. 2017, 150, 63–73. [Google Scholar] [CrossRef] [PubMed]
- Čadež, V.; Škapin, S.D.; Leonardi, A.; Križaj, I.; Kazazić, S.; Salopek-Sondi, B.; Sondi, I. Formation and morphogenesis of a cuttlebone’s aragonite biomineral structures for the common cuttlefish (Sepia officinalis) on the nanoscale: Revisited. J. Colloid Interface Sci. 2017, 508, 95–104. [Google Scholar] [CrossRef]
- Tanner, A.R.; Fuchs, D.; Winkelmann, I.E.; Gilbert, M.T.P.; Pankey, M.S.; Ribeiro, Â.M.; Kocot, K.M.; Halanych, K.M.; Oakley, T.H.; Da Fonseca, R.R.; et al. Molecular clocks indicate turnover and diversification of modern coleoid cephalopods during the Mesozoic Marine Revolution. Proc. R. Soc. B Biol. Sci. 2017, 284, 20162818. [Google Scholar] [CrossRef] [Green Version]
- Marin, F.; Gillibert, M.; Westbroek, P.; Muyzer, G.; Dauphin, Y. Evolution: Disjunct degeneration of immunological determinants. Neth. J. Geosci. 1999, 78, 135–139. [Google Scholar] [CrossRef]
Figure 1.
Macrophotography of the shell of Argonauta hians. (A). Apertural view. (B). Dorsal view. (C). Left lateral view. Note the pigmented protuberances of the keel. The dashed squares with numbers indicate the location of area sampled for SEM investigation of the shell wall.
Figure 1.
Macrophotography of the shell of Argonauta hians. (A). Apertural view. (B). Dorsal view. (C). Left lateral view. Note the pigmented protuberances of the keel. The dashed squares with numbers indicate the location of area sampled for SEM investigation of the shell wall.

Figure 2.
Shell microstructure of Argonauta hians. The localization of the following pictures is indicated in the shell, illustrated at the left top corner of the figure. (A) General view of the shell wall, showing two layers of fibrous calcite separated by a central core. (B,C) Close-up view of the interface between the central core and the calcitic layers, showing the gradual transition from a spherulite into fibers (C). (D) Magnification of the central core (in back-scattered electron mode), which appears darker than the two calcitic layers. This suggests a higher content of organic material. (E) Illustration of a depositional accident, showing the re-initialization of the mineralization from a spherulite to fibers. (F) FT-IR spectra of the shell powder of the white and black parts of the keel. The white arrows indicate the exterior of the shell.

Figure 3.
Shell microstructure of Argonauta hians. (A) Lateral view of the shell illustrating the two different locations of the following pictures. (B) General view of the enrolment axis of the shell. (C) Magnification (back-scattered electron mode) of the birth of the central core wrapped by the fibrous calcite. (D) General view of the aperture of the shell, on the dorsal side, showing the edge of the central “core” and the calcitic material surrounding it. (E) Close-up view of the edge of the central core, showing that this layer is sandwiched, on either side, by a calcite bevel and finally wrapped in a continuous layer of calcite.

Figure 4.
FT-IR spectra of three shell extracts acquired in Attenuated Total Reflectance mode (ATR). Note that the two ASMs, in spite of the extended bleaching treatment for ASM2, are almost superimposable. Due to low quantity, AIM2 could not be analyzed.
Figure 4.
FT-IR spectra of three shell extracts acquired in Attenuated Total Reflectance mode (ATR). Note that the two ASMs, in spite of the extended bleaching treatment for ASM2, are almost superimposable. Due to low quantity, AIM2 could not be analyzed.

Figure 5.
75.4 MHz 13C CPMAS spectra of (a) of α-chitin standard (shrimp), (b) the cleaned shell of Argonauta hians (vertically extended), and of its extracts (c) acid soluble and (d) acid insoluble matrices (AIM1 and ASM1). AIM of A. hians shells is primarily proteinaceous content while (oligo)saccharides (characteristic shifts of chitin indicated by the dashed line), if present, comprise less than a 10% fraction. ASM exhibits a pronounced oligosaccharide(s) content and less pronounced proteinaceous content.

Figure 6.
121.85 MHz 31P CP MAS NMR spectra of the Argonauta hians shell extracts: (a) cleaned shell, (b) acid soluble matrix (ASM) and (c) acid insoluble matrix (AIM).
Figure 6.
121.85 MHz 31P CP MAS NMR spectra of the Argonauta hians shell extracts: (a) cleaned shell, (b) acid soluble matrix (ASM) and (c) acid insoluble matrix (AIM).

Figure 7.
Monodimensional gel electrophoresis of shell extracts of Argonauta hians (ASM and Laemmli-soluble AIM). Silver nitrate (left), Bio-Rad Blue (middle) and carbocyanine (right) staining were applied. The arrows point out discrete bands while the white star indicates the slimy purple stain obtained with carbocyanine on ASM.

Figure 8.
In vitro crystallization of calcite in the presence of ASM1 (top panel) and of ASM2 (lower panel) extracted from Argonauta hians shell. Note that both extracts exert moderate effects, even at high concentrations.
Figure 8.
In vitro crystallization of calcite in the presence of ASM1 (top panel) and of ASM2 (lower panel) extracted from Argonauta hians shell. Note that both extracts exert moderate effects, even at high concentrations.

Figure 9.
Western-blot of the ASM1 and laemmli soluble-acid insoluble matrix (LS-AIM1) extracts of the shell of Argonauta hians. The blotted extracts were incubated with a polyclonal antibody preparation (2nd and 3rd bleeding) elicited against a protein fraction, P95, identified in the soluble shell matrix of the freshwater mussel, Unio pictorum. The membrane was stained with BCIP/NBT (5-bromo-4-chloro-3-indolyl-phosphate/nitro blue tetrazolium). The pre-immune serum was used as negative control. Right sides: molecular weight standards.

Figure 10.
Immunogold labeling of shell preparations with anti-P95 antibody. The left panel (A) shows a general view of the shell wall, while the middle panel represents magnification of the outer (B) and inner (F) layers. The right panel corresponds to different negative controls, namely without the first antibody (anti-P95; C,G), without the second antibody GAR-AP (Goat anti-Rabbit, conjugated to alkaline phosphatase, D,H) and an absolute blank (E,I). An intense staining is observed in the central ”core” layer (A), while the staining is more diffuse in the surrounding fibrous layers (B,F).

Figure 11.
Lectin-gold labeling of shell preparations with biotinylated concanavalin A. The left panel (A) shows a general view of the shell wall, while the middle panel represents magnification of the outer (B) and inner (F) layers. The right panel corresponds to different negative controls, namely without the lectin (C,G), without the GABIO (D,H) and an absolute blank (E,I). A, B and C show that the labeling is diffuse in the mineralized layers.


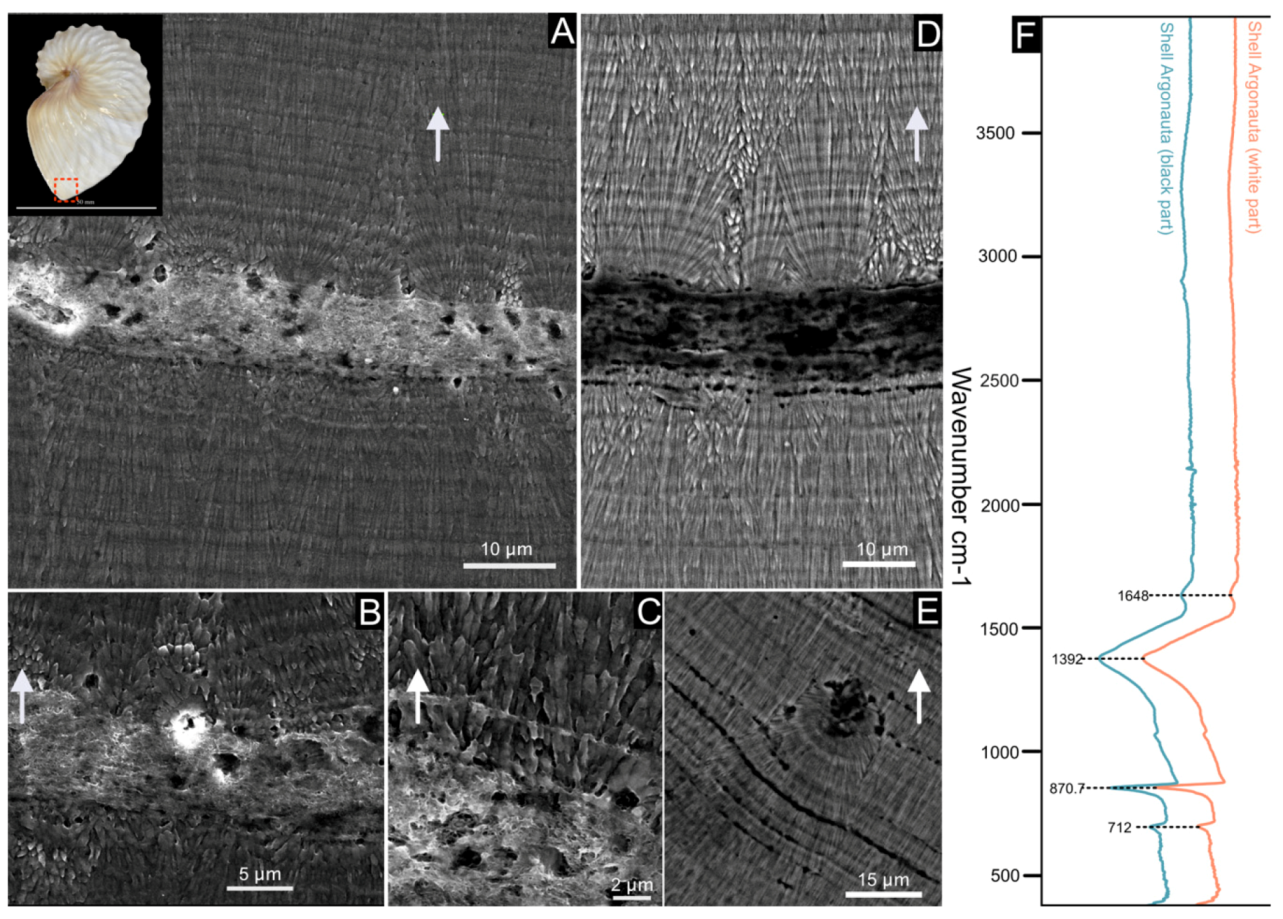
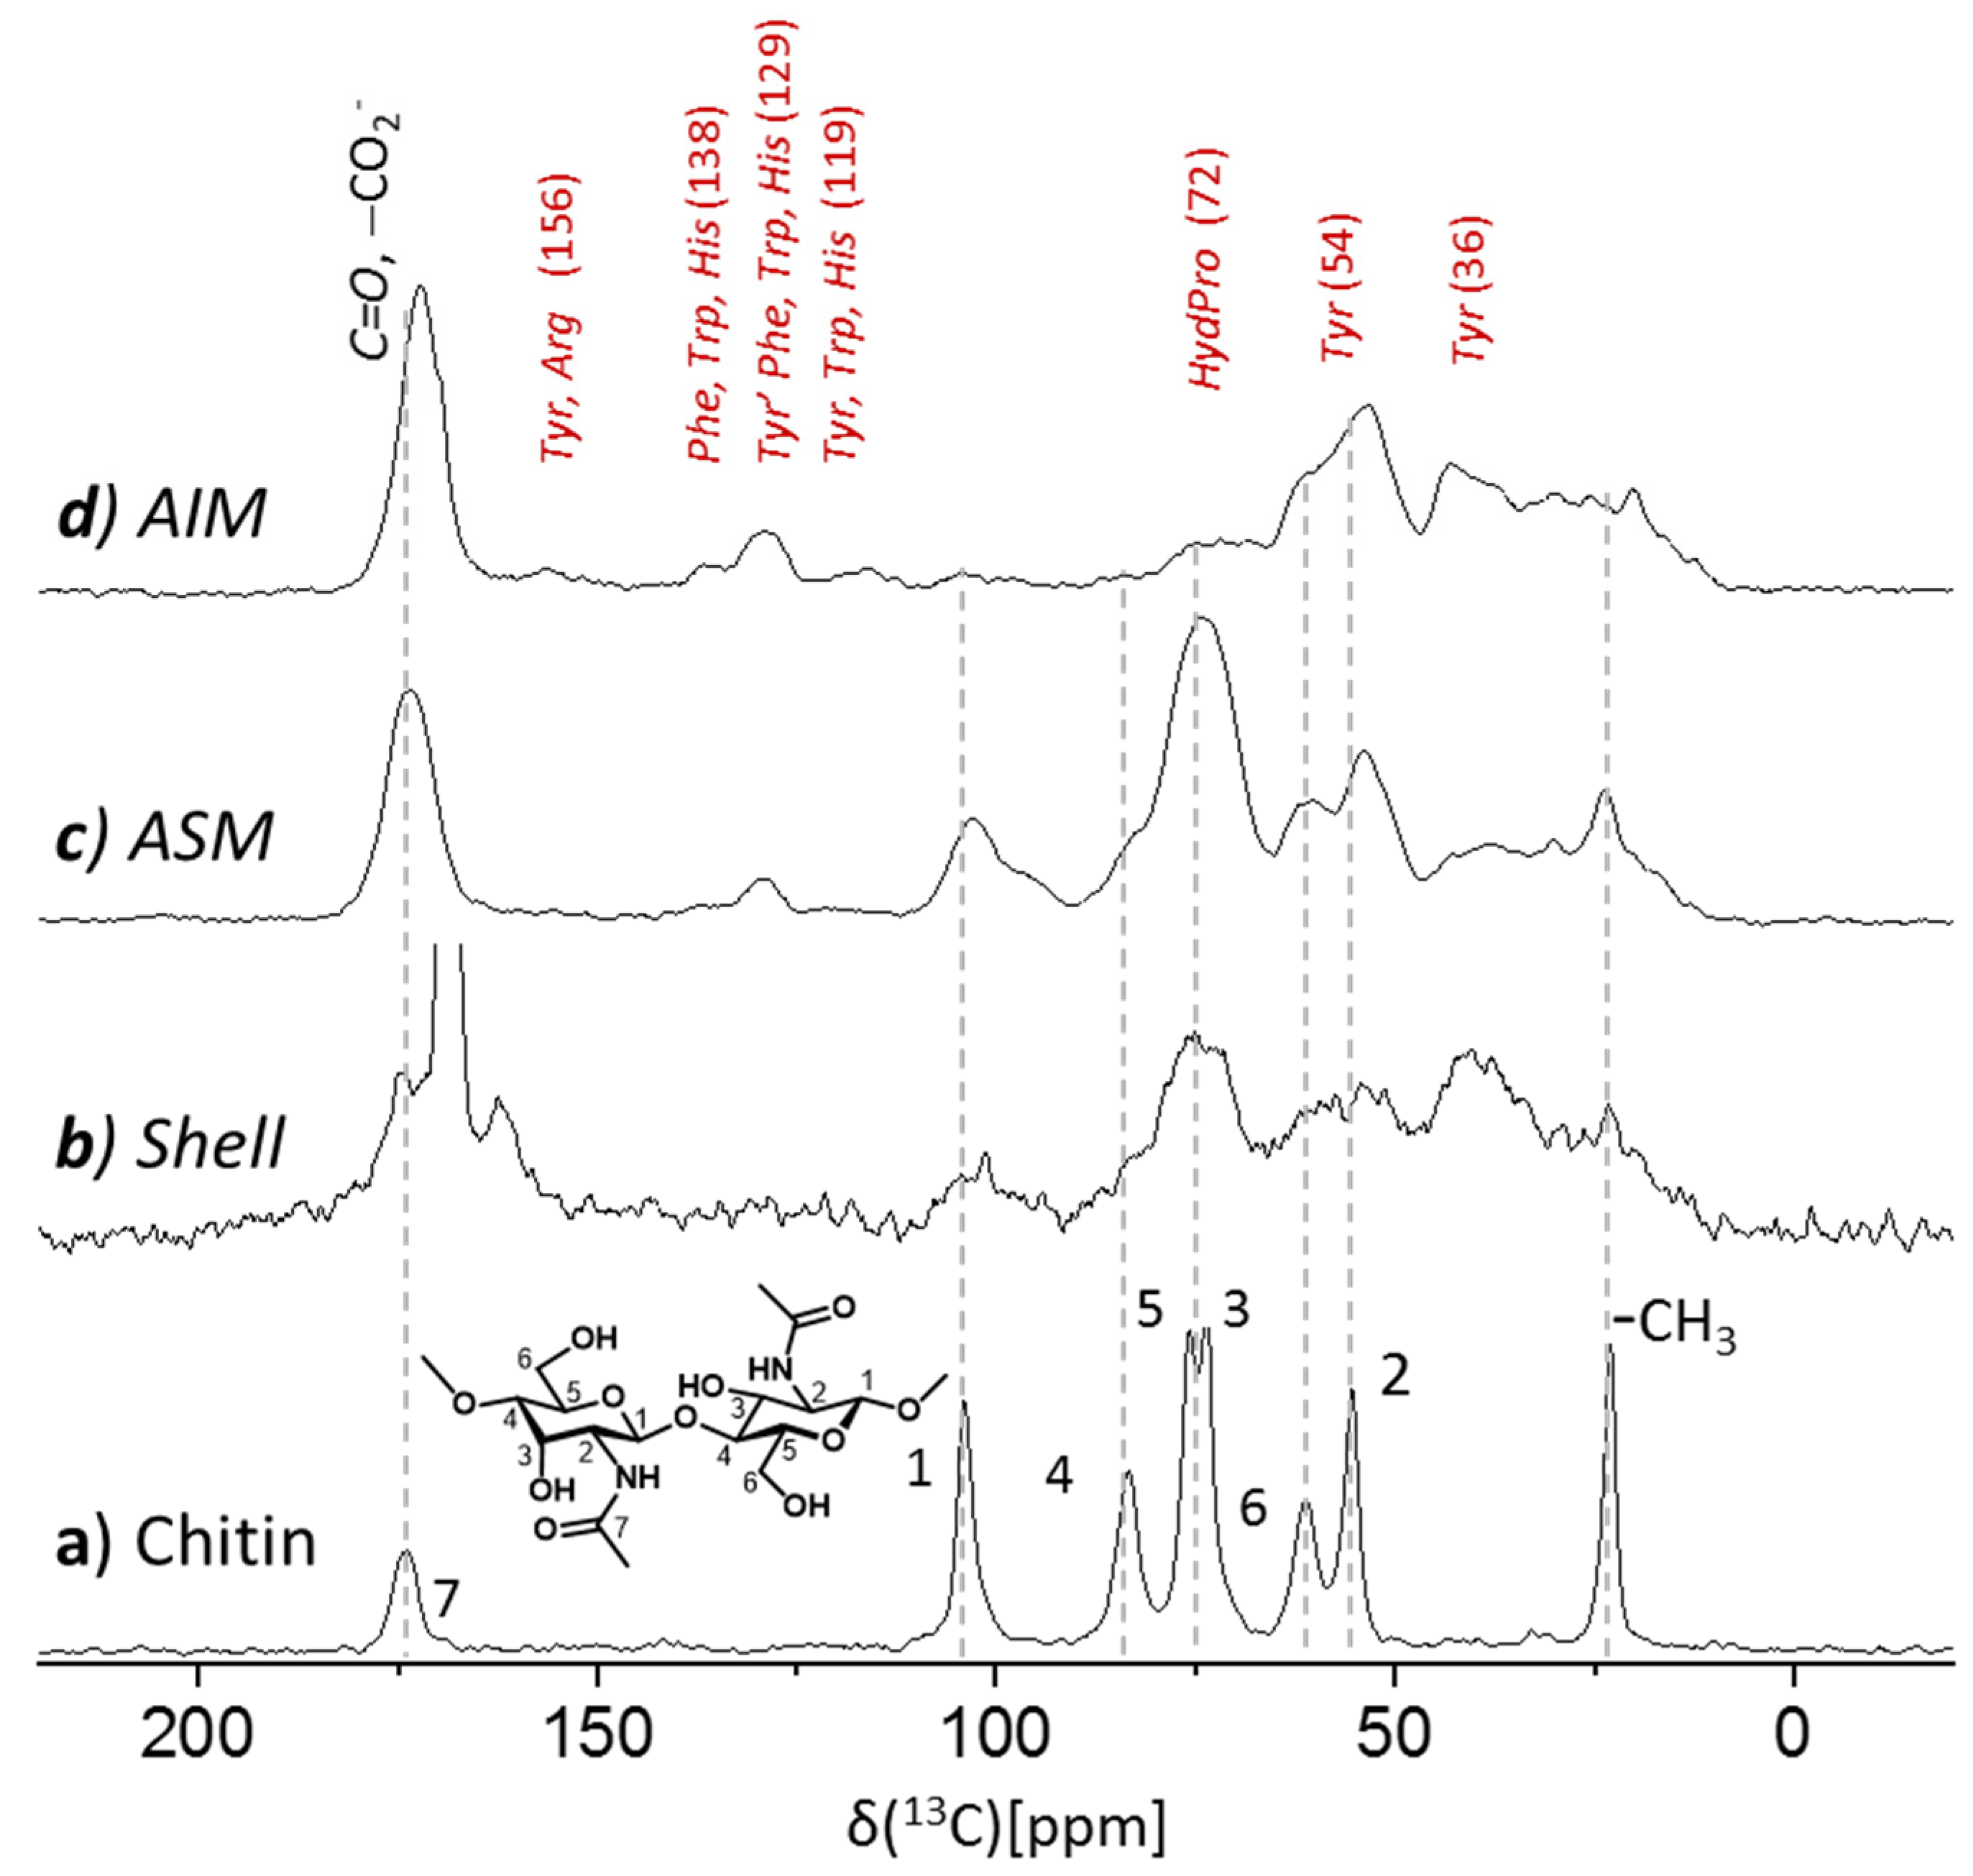
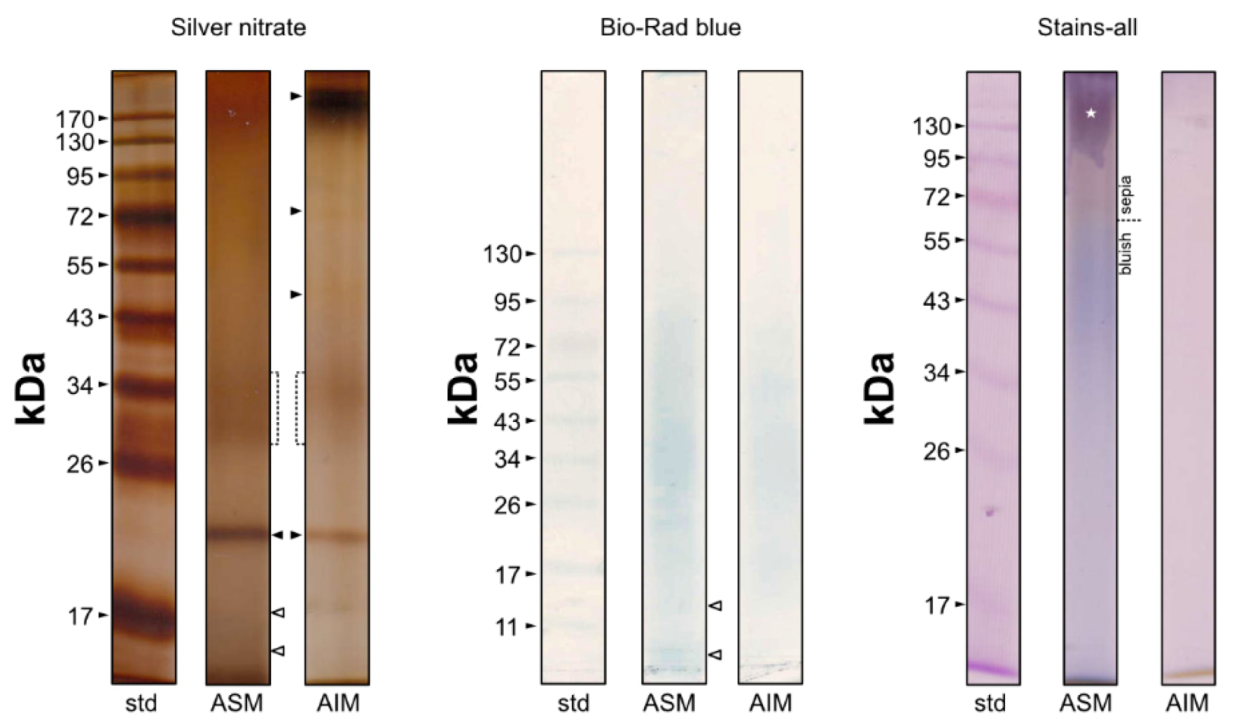
Table 1.
Quantity of shell matrices (soluble and insoluble) extracted from the shell of A. hians. The first extraction was performed after one and two bleaching treatments, while the second and the third extractions were done after one bleaching treatment. ASM: acid soluble matrix; AIM: acid insoluble matrix.
| Fractions | Shell Powder (g) | Shell Matrix after Lyophilisation (mg) | Shell Weight % | Whole Shell Matrix (Shell Weight %) | |
|---|---|---|---|---|---|
| 1st extraction | ASM1 | 1.86 | 18.13 | 0.97 | 1.74 |
| AIM1 | 14.42 | 0.77 | |||
| ASM2 | 1.95 | 17.90 | 0.91 | ≈0.93 | |
| AIM2 | <<1—not quantified | Not quantified | |||
| 2nd extraction | ASM | 2.97 | 27.67 | 0.93 | 1.78 |
| AIM | 25.25 | 0.85 | |||
| 3rd extraction | ASM | 3.76 | 39.70 | 1.05 | 1.78 |
| AIM | 27.50 | 0.73 |
Table 2.
Quantification of the sugar content of the soluble shell matrix of A. hians. The upper panel depicts the total sugar quantification (based on two standards, glucose, and maltose) while the lower one indicates the concentration of sulfated glycosaminoglycans (GAGs).
Table 2.
Quantification of the sugar content of the soluble shell matrix of A. hians. The upper panel depicts the total sugar quantification (based on two standards, glucose, and maltose) while the lower one indicates the concentration of sulfated glycosaminoglycans (GAGs).
| Total Sugar Determination | ||
|---|---|---|
| % of the Whole Matrix | ||
| Standard | % min | % max |
| Glucose | 4 | 10.7 |
| Maltose | 6 | 11 |
| Sulfated Glycosaminoglycan Determination | ||
| Chondroitin-4-sulfate | 9 | 12 |
Table 3.
ELISA test on the ASM of A. hians. The matrix was tested against 17 polyclonal antibodies raised against diverse mollusc shell fractions or purified proteins (see Supplementary Table S1). XXX = >80% cross-reactivity; XX = 50–80% cross-reactivity; -- = <10% cross-reactivity.
Table 3.
ELISA test on the ASM of A. hians. The matrix was tested against 17 polyclonal antibodies raised against diverse mollusc shell fractions or purified proteins (see Supplementary Table S1). XXX = >80% cross-reactivity; XX = 50–80% cross-reactivity; -- = <10% cross-reactivity.
| Antibody Names | Cross-Reactivity |
|---|---|
| K5087 | -- |
| K5088 | -- |
| K5089 | -- |
| K5090 | -- |
| K4772 | -- |
| K4951 | -- |
| K4952 | -- |
| Preserum α-caspartin | -- |
| α-caspartin 17 | -- |
| α-calprismin 37 | -- |
| α-mucoperlin | -- |
| α-crassostrein | -- |
| α-prism Pmarg | -- |
| α-nacre Pmarg | -- |
| α-Mytilus SM | -- |
| α-N63 | -- |
| α-ASM deg. Upict J39 | -- |
| α-ASM deg. Upict J55 | -- |
| α-P95 J53 | XXX |
| α-P95 J62 | XX |
XXX: >80% XX: 50–80% --: <10%.
Table 4.
Enzyme-Linked Lectin Assay (ELLA) test on the ASM of A. hians. The matrix was tested against 21 biotinylated lectins, expressed in absolute reactivity values of the optical density. --- = < 0.28 Optical Density (OD); --+ = 0.28 < OD < 0.33; -++ = 0.33 < OD < 0.44.
Table 4.
Enzyme-Linked Lectin Assay (ELLA) test on the ASM of A. hians. The matrix was tested against 21 biotinylated lectins, expressed in absolute reactivity values of the optical density. --- = < 0.28 Optical Density (OD); --+ = 0.28 < OD < 0.33; -++ = 0.33 < OD < 0.44.
| Lectins | Reactivity (Based on Absolute Value of The Optical Density) |
|---|---|
| ConA | - + + |
| SBA | - - + |
| WGA | - + + |
| DBA | - - - |
| UEA 1 | - - - |
| RCA | - - - |
| PNA | - - - |
| GSL 1 | - - - |
| PSA | - - - |
| LCA | - - - |
| PHA-E | - - - |
| PHA-L | - - + |
| SJA | - - + |
| succ-WGA | - - + |
| GSL 2 | - - + |
| DSL | - + + |
| ECL | - - - |
| Jac | - - + |
| LEL | - - + |
| STL | - - + |
| VVA | - - - |
- - -: X < 0.280; - - +: 0.280 < X < 0.330; - + +: 0.330 < X < 0.440.
Table 5.
(A) List of the peptides identified by proteomics, in each of the four tested fractions, according to two stringencies: trypsin and semi-trypsin modes. (B) Shared peptides by extract, compared two by two (the common denominator refers to the number of peptides identified in the reference extract).
| A | List of Peptides Identified Per Extract | |||||||||
|---|---|---|---|---|---|---|---|---|---|---|
| Trypsin | Semi-Trypsin | |||||||||
| AIM1 | 27 AGFAGDDAPR; AGLQFPVGR; DAIILFK; DAVTYTEHAK; DSYVGDEAQSK; EDIVIAK; EITALAPSTMK; EVQTAVR; GYSFTTTAER; IGSLNSR; ISGLIYEETR; KDTDNIGSSK; LLEGEESR; LLLPGELAK; LNSLSNR; LSSGLNISR; NLSGKER; QVDSVQR; SGSFLSR; SMESCQGDTCK; SSVTTGGVVGR; STELLIR; TFVQGLSIGR; TITLEVEPSDTIENVK; TLSDYNIQK; VAPEEHPVLLTEAPLNPK; VATVSLPR | 50 AFSSNIR; AGFAGDDAPR; AGLQFPVGR; CGGMYQILGK; CLSNGTIKCTE; DAVTYTEHAK; DDFDINR; DSYVGDEAQSK; EGAEVLAKELPQ; EITALAPSTMK; EVHSNVGTSK; EVQTAVR; GSSMKSVGEAMAIGR; GYSFTTTAER; IDENNVPEK; IGSNLSR; ISGLIYEETR; IVDGGISR; IYLSGQK; KDTDNIGSSK; LEITDVQR; LLEGEESR; LLGAFQK; LLLPGELAK; LSSGLNISR; LSSGLNISRN; LSVNLGSGK; MGSGIQYGDA; NLSSINR; NSFDLNR; QSVECESR; SEGSTLTK; SFTIHLGAQMK; SGVQFSK; SMESCQGDTCK; SSSGIGSISSSR; SSSLGFR; SSSVSASSTPSSPTSR; STELLIR; TFVQGLSIGR; TITLEVEPSDTIENVK; TLSDYNIQK; TQSLSHASTTTR; VADGVFR; VAGSVAGR; VAPEEHPVLLTEAPLNPK; VATVSLPR; VGGLNFR; VVSLISPR; YTKIGNTMDR | ||||||||
| AIM2 | 57 AGLQFPVGR; AVFVDLEPTVVDEIR; AVLVDLEPGTMDSVR; DAGTIAGLNVMR; DAIILFK; DAVTYTEHAK; DFDQLSPEQSK; DGVITVK; DLTDYLMK; DNIQGITKPAIR; DSYVGDEAQSK; DVNAAIATIK; EDIVIAK; EIQTAVR; EITALAPSTMK; ELISNASDALDK; EREGALK; EVSYVNAR; FDLTGIPSAPR; GVVDSEDLPLNISR; GYSFTTTAER; IGGIGTVPVGR; IIAPPER; IKDPSAK; ILEFFGLK; ILGSVGIEAEASK; ILVGTNFNAVAK; IQLLEEDLER; ISGLIYEETR; LDEVFEK; LDPPLSATDPDK; LEAAEAR; LLLPGELAK; LNDGFYSIK; LNSLSNR; LPLQDVYK; LSDECQEAVR; LVDDLADR; MDATANDLEDIK; NLIGVLK; NLLSVAYK; QEFINEGK; QFSIVAR; SASVDINR; STELLIR; SVDEALR; SYELPDGQVITIGNER; TISDLVK; TNKFDEFFK; TPAYFITK; TVQASVK; TVTAMDVVYALK; VAPEEHPVLLTEAPLNPK; VATVSLPR; VDATIEVDLAEK; VFLENVIR; VISSIEQK | 77 AAGAGDVTANK; AFSSNIR; AGLQFPVGR; AIEENAVGLSDIA; AVFPSIVGR; AVFVDLEPTVVDEIR; AVLVDLEPGTMDSVR; CLSNGTIKCTE; DAGTIAGLNVMR; DAIILFK; DAVTYTEHAK; DFDQLSPEQSK; DLTDYLMK; DNIQGITKPAIR; DSLEICK; DSYVGDEAQSK; DVNAAIATIK; EDIVIAK; EIQTAVR; EITALAPSTMK; ELISNASDALDK; ELTEIR; EVSYVNAR; FDLTGIPSAPR; FTPKYMR; GVVDSEDLPLNISR; GYSFTTTAER; IDENNVPEK; IETEISK; IGGIGTVPVGR; IIAPPER; IISNASCTTNCLAPLAK; ILEFFGLK; ILGSVGIEAEASK; ILVGTNFNAVAK; INSGSLGTVGR; IQLLEEDLER; ISGLIYEETR; IYLSGQK; KGGFEPK; LDPPLSATDPDK; LEAAEAR; LGNDDVK; LGTTVIK; LLLPGELAK; LPLQDVYK; LSDECQEAVR; LSDFYTK; LVDDLADR; MDATANDLEDIK; NLIGVLK; NLLSVAYK; NTQIIDP; QCTCTYK; QEFINEGK; QMCDGSLVAK; SFTIHLGAQMK; SGDDVIVIDR; SIMSVIEK; SKGFDSK; SPATLNSR; SSLKSQPQGNK; SSPATLNSR; STELLIR; STIPKPK; SYELPDGQVITIGNER; TIDSLVK; TNKFDEFFK; TPAYFITK; TVQASVK; TVTAMDVVYALK; VAPEEHPVLLTEAPLNPK; VDATIEVDLAEK; VFLENVIR; VGGLNFR; VISSIEQK; VVSLISPR | ||||||||
| ASM1 | 76 AGGFGVAMSK; AGLQFPVGR; AKLDEVFEK; ATMEGILAR; AVDTSIYCK; AVFPSIVGRPR; AVFVDLEPTVVDEIR; DAGTIAGLNVMR; DAIILFK; DAVTYTEHAK; DFDQLSPEQSK; DIDEIVLVGGSTR; DLDEMLVQSR; DLYANTVLSGGTSMYPGIADR; DNIQGITKPAIR; DSYVGDEAQSK; DVNAAIATIK; EDIVIAK; EIAEAYLGK; EIQTAVR; ELISNASDALDK; FLESGGK; GDILAAR; GLDVIAQAQSGTGK; GYSFTTTAER; HQGVMVGMGQK; IASDGLK; IFSGDIK; IGGIGTVPVGR; IIAPPER; IINEPTAAAIAYGLDK; ILVGTNFNAVAK; IMNTFSVVPSPK; ISEQFTAMFR; ISGLIYEETR; LAPEYEK; LDEVFEK; LEAAEAR; LFSDYLYFGK; LLEGEESR; LLLPGELAK; LQNTDYR.; LSDECQEAVR; LSSGLNISR; MDATANDLEDIK; NCVDATDGLK; NLIGVLK; NLLSVAYK; QFSIVAR; QNKSAVK; QVLVNILVK; SASVDINR; SGSFLSR; STELLIR; SYELDTIAAAQGIK; SYELPDGQVITIGNER; TFVQGLSIGR; TITLEVEPSDTIENVK; TLEINPR; TLEPVEK; TLSDYNIQK; TNKFDEFFK; TPAYFITK; TSEGLDELDTK; TTPSYVAFTDAER; TVTAMDVVYALK; VAPEEHPVLLTEAPLNPK; VATVSLPR; VFLENVIR; VFSGTVSTGQK; VLITTDLLAR; VLSPDAK; VSAIDAFR; YDIILIQEIR; YEDENKLR; YLTVATIFR | 99 ADPIAYR; AFSSNIR; AGGFGVAMSK; AGLQFPVGR; AKLDEVFEK; ATMEGILAR; AVDTSIYCK; AVFPSIVGR; AVFPSIVGRPR; AVFVDLEPTVVDEIR; CLSNGTIKCTE; DAGTIAGLNVMR; DAIILFK; DAVTYTEHAK; DFDQLSPEQSK; DIDEIVLVGGSTR; DLDEMLVQSR; DLYANTVLSGGTSMYPGIADR; DNIQGITKPAIR; DSYVGDEAQSK; DVNAAIATIK; EDIVIAK; EIAEAYLGK; EIQTAVR; ELISNASDALDK; FLESGGK; GDILAAR; GLDVIAQAQSGTGK; GYSFTTTAER; HQGVMVGMGQK; IASDGLK; IFSGDIK; IGGIGTVPVGR; IIAPPER; IINEPTAAAIAYGLDK; IINEPTAAALAYGLDK; ILVGTNFNAVAK; IMNTFSVVPSPK; ISEQFTAMFR; ISGLIYEETR; IVDLILR; IYLSGQK; KVISETK; LAPEYEK; LDEVFEK; LEAAEAR; LEQLLQR; LFSDYLYFGK; LLEGEESR; LLLPGELAK; LNGSNIR; LQNTDYR; LQNYNAKEN; LSDECQEAVR; LSDFYTK; LSVNLGSGK; MDATANDLEDIK; MGSGIQYGDA; NLIGVLK; NSFDLNR; NTQIIDP; QCTCTYK; QNKSAVK; QVLVNILVK; SEGSTLTK; SFTIHLGAQMK; SGDDVIVIDR; SGDNVILLDR; SGVQFSK; SPATLNSR; SRPPVLPNDK; SSPATLNSR; SSSLGFR; STELLIR; SYELDTIAAAQGIK; SYELPDGQVITIGNER; TFVQGLSIGR; TITLEVEPSDTIENVK; TLEINPR; TLEPVEK; TLSDYNIQK; TNKFDEFFK; TPAYFITK; TSEGLDELDTK; TTPSYVAFTDAER; TVTAMDVVYALK; VAPEEHPVLLTEAPLNPK; VDLVERVNEFLK; VFLENVIR; VFSGTVSTGQK; VGTRVDAK; VLITTDLLAR; VSAIDAFR; VSVFMDK; VVSLISPR; YDIILIQEIR; YEDENKLR; YGSGSLTGFLSTDK; YLTVATIFR | ||||||||
| ASM2 | 65 AGLQFPVGR; AKLDEVFEK; AVFVDLEPTVVDEIR; AVLVDLEPGTMDSVR; DAGTIAGLNVMR; DAHFILR; DAIILFK; DAVTYTEHAK; DIDEIVLVGGSTR; DLDEMLVQSR; DLYANTVLSGGSTMYPGIADR; DSYVGDEAQSK; DSYVGDEAQSKR; DTYSISSQR; DVNAAIATIK; EIAEAYLGK; EITALAPSTMK; EQFSNYR; EQLRDPIQEVK; EVDEQMLNIQSK; FDLTGIPSAPR; GDILAAR; GVVDSEDLPLNISR; HLQLAIR; IAGEASR; IASDGLK; IDSLSVR; IFSGDIK; IINEPTAAAIAYGLDK; ILGSVGIEAEASK; ILVGTNFNAVAK; ISGLIYEETR; KDTDNIGSSK; KVEVEVK; LAVNMVPFPR; LEAAEAR; LGVIEDPSNR; LIPMMDLNK; LLLPGELAK; LNSLSNR; LSDECQEAVR; LTTYTALMQAK; LVDDLADR; MDATANDLEDIK; NLLSVAYK; NNIVIQNDQNR; QFSIVAR; QVLVNILVK; SAIMTGR; SASVDINR; STELLIR; TASEHVIK; TFVQGLSIGR; TNKFDEFFK; TSEGLDELDTK; TVQASVK; TVTAMDVVYALK; VACTNWR; VAPEEHPVLLTEAPLNPK; VATVSLP; VDNICNVAK; VFSGTVSTGQK; VLSPDAK; VTAEDKGTGNK; YDEMVSNMK | 83 ADQDDDSLVR; AFSSNIR; AGLQFPVGR; AKLDEVFEK; AVFVDLEPTVVDEIR; AVLVDLEPGTMDSVR; DAGTIAGLNVMR; DAHFILR; DAIILFK; DAVTYTEHAK; DIDEIVLVGGSTR; DIENIPVPKP; DLDEMLVQSR; DLYANTVLSGGSTMYPGIADR; DSYVGDEAQSK; DSYVGDEAQSKR; DTYSISSQR; DVNAAIATIK; ECKAGAAEK; EGAEVLAKELPQ; EGNNFQLFQ; EIAEAYLGK; EITALAPSTMK; EQFSNYR; EQLRDPIQEVK; EVDEQMLNIQSK; FDLTGIPSAPR; FSEGSTLTK; GDILAAR; GVVDSEDLPLNISR; HLQLAIR; IAGEASR; IASDGLK; IDENNVPEK; IFSGDIK; IINEPTAAAIAYGLDK; ILGSVGIEAEASK; ILVGTNFNAVAK; ISGLIYEET; IYLSGQK; KDTDNIGSSK; KTDTDNWK; LAVNMVPFPR; LEAAEAR; LGNDDVK; LGVIEDPSNR; LLLPGELAK; LSDECQEAVR; LSDFYTK; LSVNLGSGK; LTTYTALMQAK; LVDDLADR; MDATANDLEDIK; MGSGIQYGDA; NLLSVAYK; NNIVIQNDQNR; NSFDLNR; QCTCTYK; QGFGCGDVR; QPSITVK; QVLVNILVK; SAIMTGR; SEGSTLTK; SGDDVIVIDR; SGDNVILLDR; SRPPVLPNDK; SSPATLNSR; SSSVSASSTPSSPTSR; STELLIR; TFVQGLSIGR; TNKFDEFFK; TSEGLDELDTK; TVTAMDVVYALK; VAALCSTIPF; VACTNWR; VAPEEHPVLLTEAPLNPK; VDNICNVAK; VFSGTVSTGQK; VSILSMR; VTAEDKGTGNK; VVSLISPR; YDEMVSNMK; YGSGSLTGFLSTDK | ||||||||
| B | Share Peptides by Extract, Two Per Two. | |||||||||
| Trypsin | Semi-trypsin | |||||||||
| AIM1 | AIM2 | ASM1 | ASM2 | AIM1 | AIM2 | ASM1 | ASM2 | |||
| AIM1 | 13/57 | 17/76 | 13/65 | AIM1 | 16/77 | 21/99 | 21/83 | |||
| AIM2 | 13/27 | 36/76 | 30/65 | AIM2 | 16/50 | 38/99 | 33/83 | |||
| ASM1 | 17/27 | 36/57 | 33/65 | ASM1 | 21/50 | 38/77 | 41/83 | |||
| ASM2 | 13/27 | 30/57 | 33/76 | ASM2 | 21/50 | 33/77 | 41/99 | |||
Table 6.
Main protein hits obtained by proteomics, according to two stringencies: trypsin (T), and semi-trypsin (ST). For each protein hit, the presence is indicated by “X”, as well as the protein coverage (Cov.) and the number of peptides (Pep.) that allow the protein identification, for each of the four extracts. A complete version of this table is available as Supplementary Table S2.
| TRYPSIN | |||||||||
|---|---|---|---|---|---|---|---|---|---|
| AIM1 | AIM2 | ASM1 | ASM2 | ||||||
| T | ST | T | ST | T | ST | T | ST | ||
| PREDICTED: histone H3.3-like Octopus bimaculoides (XP_014778206.1) | P/A | X | X | X | X | X | X | X | X |
| Cov. | 15.6% | 17% | 10.8% | 10.88% | 10.8% | 10.88% | 10.8% | 10.88% | |
| Pep. | 3 | 3 | 2 | 2 | 2 | 2 | 2 | 2 | |
| Histone H4 Acrolepiopsis assectella (H4_ACRAS) | P/A | X | X | X | X | X | |||
| Cov. | 19.4% | 19.41% | 62.13% | 50.5% | 33% | ||||
| Pep. | 2 | 2 | 6 | 5 | 3 | ||||
| Tubulin alpha chain Enteroctopus dofleini (TBA_ENTDO) | P/A | X | X | X | X | X | X | ||
| Cov. | 5.54% | 5.54% | 5.54% | 5.54% | 5.54% | 5.54% | |||
| Pep. | 2 | 2 | 2 | 2 | 2 | 2 | |||
| TROPOMYOSIN Spirula spirula (Gene.1464c49820) | P/A | X | X | X | X | X | X | ||
| Cov. | 15.6% | 13.93% | 5.7% | 5.74% | 5.7% | 5.74% | |||
| Pep. | 2 | 2 | 1 | 1 | 1 | 1 | |||
| Actin Brugia malayi (ACT_BRUMA) | P/A | X | X | X | X | ||||
| Cov. | 16% | 16% | 21.5% | 23.93% | |||||
| Pep. | 5 | 5 | 7 | 8 | |||||
| Ubiquitin Ceratitis capitata (UBIQ_CERCA) | P/A | X | X | X | X | ||||
| Cov. | 33% | 33% | 33% | 33% | |||||
| Pep. | 2 | 2 | 2 | 2 | |||||
| TRANSCRIPTIONAL REGULAR ATRX-like Spirula spirula (Gene.30195::c80181) | P/A | X | X | ||||||
| Cov. | 5% | 5% | |||||||
| Pep. | 1 | 1 | |||||||
| MITOCHONDRIAL TRANSCRIPTION RESCUE FACTOR Spirula spirula (Gene.23120::c53195) | P/A | X | X | X | |||||
| Cov. | 9% | 10.1% | 9% | ||||||
| Pep. | 1 | 2 | 1 | ||||||
| 60S RIBOSOMAL PROTEIN Spirula spirula (Gene.29788::c77903) | P/A | X | X | X | X | ||||
| Cov. | 14.3% | 14.3% | 14.3% | 14.3% | |||||
| Pep. | 1 | 1 | 1 | 1 | |||||
| HEPARAN SULFATE SULFOTRANSFERASE Spirula spirula (Gene.5097::c36049) | P/A | X | X | X | X | ||||
| Cov. | 2.35% | 2.35% | 5% | 5% | |||||
| Pep. | 1 | 1 | 2 | 2 | |||||
| 14-3-3 protein zeta Aedes aegypti (1433Z_AEDAE) | P/A | X | X | X | |||||
| Cov. | 6.45% | 6.45% | 3.2% | ||||||
| Pep. | 2 | 2 | 1 | ||||||
| Histone H2B.1/H2B.2 Tigriopus californicus (H2B1_TIGCA) | P/A | X | X | X | X | ||||
| Cov. | 13% | 13% | 13% | 13% | |||||
| Pep. | 2 | 2 | 2 | 2 | |||||
| TUBULIN (beta) Spirula spirula (Gene.2411c23358) | P/A | X | X | X | X | ||||
| Cov. | 7% | 7% | 8.3% | 2.7% | |||||
| Pep. | 3 | 3 | 3 | 1 | |||||
| ELONGATION FACTOR Spirula spirula (Gene.193c18579) | P/A | X | X | X | X | ||||
| Cov. | 6.5% | 6.5% | 6.5% | 6.5% | |||||
| Pep. | 1 | 1 | 1 | 1 | |||||
| PREDICTED: uncharacterized protein LOC106879316 Octopus bimaculoides (XP_014784309.1) | P/A | X | |||||||
| Cov. | 5.46% | ||||||||
| Pep. | 1 | ||||||||
| Potassium channel toxin alpha-KTx 18.1 Tityus obscurus (KA181_TITOB) | P/A | X | X | ||||||
| Cov. | 31.42% | 31.42% | |||||||
| Pep. | 1 | 1 | |||||||
| PREDICTED: uncharacterized protein LOC106881861 Octopus bimaculoides (XP_014787865.1) | P/A | X | |||||||
| Cov. | 5.64% | ||||||||
| Pep. | 1 | ||||||||
| Actin, cytoskeletal Heliocidaris erythrogramma (ACTM_HELER) | P/A | X | X | ||||||
| Cov. | 27.9% | 24.73% | |||||||
| Pep. | 8 | 9 | |||||||
| ATP-dependent RNA helicase OR eukaryotic initiation factor Spirula spirula (Gene.3798::c31126) | P/A | X | X | ||||||
| Cov. | 5.66% | 5.66% | |||||||
| Pep. | 2 | 2 | |||||||
| UNCHARACTERIZED Spirula spirula (Gene.2897c68969) | P/A | X | X | ||||||
| Cov. | 6.1% | 6.1% | |||||||
| Pep. | 1 | 1 | |||||||
| Actin-3 Diphyllobothrium dendriticum (ACT3_DIPDE) | P/A | X | X | ||||||
| Cov. | 13.53% | 13.53% | |||||||
| Pep. | 4 | 4 | |||||||
| PROTEIN DISULPHIDE ISOMERASE Spirula spirula (Gene.3279::c29062) | P/A | X | X | ||||||
| Cov. | 7.29% | 7.29% | |||||||
| Pep. | 4 | 4 | |||||||
| Actin-3 (Fragment) Echinococcus granulosus (ACT3_ECHGR) | P/A | X | X | ||||||
| Cov. | 16.18% | 16.18% | |||||||
| Pep. | 3 | 3 | |||||||
| 14-3-3 PROTEIN Spirula spirula (Gene.2785c60160) | P/A | X | X | ||||||
| Cov. | 6.51% | 6.51% | |||||||
| Pep. | 2 | 2 | |||||||
| Histone H2A, sperm (Fragment) Lytechinus pictus (H2A3_LYTPI) | P/A | X | X | ||||||
| Cov. | 14.28% | 14.28% | |||||||
| Pep. | 2 | 2 | |||||||
| Histone H2B.1, embryonic Psammechinus miliaris (H2BE1_PSAMI) | P/A | X | X | ||||||
| Cov. | 13% | 13% | |||||||
| Pep. | 2 | 2 | |||||||
| ENDOPLASMIN-LIKE Spirula spirula (Gene.16::c147) | P/A | X | X | ||||||
| Cov. | 7.63% | 7.63% | |||||||
| Pep. | 1 | 1 | |||||||
| SEMI-TRYPSIN | |||||||||
| PREDICTED: ras-related protein Rab-4B-like Octopus bimaculoides (XP_014772694.1) | P/A | X | X | X | |||||
| Cov. | 5.49% | 5.49% | 5.49% | ||||||
| Pep. | 1 | 1 | 1 | ||||||
| E3 ubiquitin-protein ligase HECTD1-like isoform Spirula spirula (Gene.28385::c63884) | P/A | X | |||||||
| Cov. | 6.18% | ||||||||
| Pep. | 1 | ||||||||
| PREDICTED: serine-rich adhesin for platelets-like isoform X2 Octopus bimaculoides (Gene.104::c674) | P/A | X | |||||||
| Cov. | 8% | ||||||||
| Pep. | 1 | ||||||||
| Histone H4 Aplysia californica (H4_APLCA) | P/A | X | X | X | |||||
| Cov. | 56.31% | 52.42% | 31% | ||||||
| Pep. | 5 | 5 | 3 | ||||||
| Glyceraldehyde-3-phosphate dehydrogenase 2 Caenorhabditis briggsae (G3P2_CAEBR) | P/A | X | |||||||
| Cov. | 4.99% | ||||||||
| Pep. | 1 | ||||||||
| PREDICTED: mitochondrial import inner membrane translocase subunit TIM14-like isoform Spirula spirula (Gene.29359::c72821) | P/A | X | |||||||
| Cov. | 5.99% | ||||||||
| Pep. | 1 | ||||||||
| PREDICTED: protein Wnt-7b-like Octopus bimaculoides (XP_014780612.1) | P/A | X | |||||||
| Cov. | 5.82% | ||||||||
| Pep. | 1 | ||||||||
| Uncharacterized protein Spirula spirula (Gene.21622c52882) | P/A | X | X | ||||||
| Cov. | 6.42% | 6.42% | |||||||
| Pep. | 1 | 1 | |||||||
© 2020 by the authors. Licensee MDPI, Basel, Switzerland. This article is an open access article distributed under the terms and conditions of the Creative Commons Attribution (CC BY) license (http://creativecommons.org/licenses/by/4.0/).
Share and Cite
MDPI and ACS Style
Oudot, M.; Shir, I.B.; Schmidt, A.; Plasseraud, L.; Broussard, C.; Neige, P.; Marin, F. A Nature’s Curiosity: The Argonaut “Shell” and Its Organic Content. Crystals 2020, 10, 839. https://doi.org/10.3390/cryst10090839
AMA Style
Oudot M, Shir IB, Schmidt A, Plasseraud L, Broussard C, Neige P, Marin F. A Nature’s Curiosity: The Argonaut “Shell” and Its Organic Content. Crystals. 2020; 10(9):839. https://doi.org/10.3390/cryst10090839
Chicago/Turabian StyleOudot, Morgane, Ira Ben Shir, Asher Schmidt, Laurent Plasseraud, Cédric Broussard, Pascal Neige, and Frédéric Marin. 2020. "A Nature’s Curiosity: The Argonaut “Shell” and Its Organic Content" Crystals 10, no. 9: 839. https://doi.org/10.3390/cryst10090839
Note that from the first issue of 2016, this journal uses article numbers instead of page numbers. See further details here.