
Sea Level Rise and Future Projections in the Baltic Sea

Forest and Land Management and Wood Processing Technologies, Institute of Forestry and Engineering, Estonian University of Life Sciences, Kreutzwaldi 5, EE51006 Tartu, Estonia
*
Author to whom correspondence should be addressed.
J. Mar. Sci. Eng. 2023, 11(8), 1514; https://doi.org/10.3390/jmse11081514
Submission received: 21 June 2023
/
Revised: 25 July 2023
/
Accepted: 27 July 2023
/
Published: 29 July 2023
Abstract
:This article aimed to provide an overview of relative and absolute sea level rise in the Baltic Sea based on different studies, where researchers have used data from tide gauges, satellite altimetry, sea level rise, and land uplift models. These results provide an opportunity to get an overview of the sea level rise in the Baltic Sea. However, to better understand the impact of sea level rise on the coastal area of the Baltic Sea, and especially in Estonia, two post-glacial land uplift models, the latest land uplift model NKG2016LU of the Nordic Commission of Geodesy (NKG) and Estonian land uplift model EST2020VEL, were used. These models enabled to eliminate post-glacial land uplift from absolute sea level rise. To determine the relative sea level rise in the coastal area of the Baltic Sea, the rates from land uplift models were compared to ESA’s BalticSEAL absolute sea level rise model. It was found that the relative sea level rise between 1995–2019 was −5 to 4.5 mm/yr (based on NKG2016LU) in the Baltic Sea. In addition, the southern area is more affected by relative sea level rise than the northern part. During the research, it was also found that the IPCC AR5 sea level projections predict a maximum relative sea level rise in the Baltic Sea by the year 2100 of between 0.3 to 0.7 m. As coastal areas in the southern part of the Baltic Sea are predominantly flat, the sea level may reach the real estate properties by the end of the 21st century. In the coastal area of Estonia, the relative sea level rise in the period 1995–2019 was −1.1 to 3.1 mm/yr (based on NKG2016LU) and −0.3 to 3.4 mm/yr (based on EST2020VEL), the difference between the land uplift models is −0.9 to 0.1 mm/y. In Estonia, the west and southwest area are most threatened by sea level rise, where the coast is quite flat. One of the largest cities in Estonia, Pärnu, is also located there. Using the ESA’s sea level and EST2020VEL land uplift models, it was found that the relative sea level rise will be 0.28 m by the year 2100. Based on the large spatial resolution IPCC AR5 sea level projections, the relative sea level rise will be on the same scale: 0.2–0.4 m.
1. Introduction
Changes in sea level are perhaps the most important and largest indicator of global climate change. To predict the consequences of climate change, it is necessary to have a comprehensive awareness of the processes in the world’s seas, including changes in sea levels. Coastal areas are directly affected by the marine climate, coastal ecosystems, and marine-related natural phenomena such as storms or tsunamis [1,2]. Sea level rise affects coastal agricultural lands, which are becoming increasingly damaged by excessive moisture and erosion [3,4]. Additionally, due to the infiltration of the salty water, the fertility of coastal agricultural lands will decline and eventually become unusable, resulting in agricultural land area in the country declining. However, among other consequences, changes in the sea level have a direct impact on the daily lives of the people in the coastal area as well, especially on their real estate. Real estate value is falling, and real estate in the area is uninhabitable [5].
The impact of climate change on rising sea levels has been thoroughly assessed in two comprehensive assessment reports initiated by the Baltic Sea Experiment (BALTEX) and its successors Baltic Earth: BACC I [6] and BACC II [7]. The experiments conducted by Meier et al. [8] indicate that the risk of coastal inundation may be most significant in the eastern and southern parts of the Baltic Sea in the future. Several studies have assessed the impact of the mean sea level rise and increased frequency of storm surges on coastal processes such as erosion and sediment transport. The areas located on the eastern and southeastern coasts of the Baltic Sea, the Gulf of Riga, and the Gulf of Finland would be particularly affected [9,10,11].
The reasons for the change in sea level in the Baltic Sea as a part of the global ocean can be roughly divided into short- and long-term effects. Among the short-term effects, wind and precipitation are the main effects influencing the sea level in the Baltic Sea, as it is connected to the Atlantic Ocean through the Danish Straits, where the main water flows from [12]. In addition, the Danish Straits have been found to have a significant impact on the sea level in the Baltic Sea, as the strong winds that blow from the west for a long period cause the sea level to rise in the eastern part of the sea and fall in the western part.
For instance, the case when a long and strong wind blows a lot of water from the Atlantic Ocean through the Danish Straits to the north-east of the sea has been studied by Suursaar, Kullas [13], and Jaagus, Suursaar [14]. Also, Bonaduce et al. [15] highlight the impact of climate change on the wave climate in the Baltic Sea. They suggest there will likely be an increase in wave heights and a shift in the dominant wave direction. These changes are attributed to climate change and can affect coastal erosion, flooding risks, and maritime activities in the region. The impact of storms on sea level cannot be ignored either. Myslenkov et al. [16] focus on storm patterns in the Baltic Sea and provide future climate projections. The study reveals an increasing frequency and intensity of storms in the region due to climate change. Frequent storms threaten the Estonian coastal area, where storm surges can cause floods and related damages, which has also occurred in recent history [7,17]. It suggests that storm tracks are shifting, leading to changes in storm occurrence patterns. These findings have implications for coastal areas, marine ecosystems, navigation, offshore operations, and coastal infrastructure in the Baltic Sea.
To estimate future sea level rise, the United Nations Intergovernmental Panel on Climate Change (IPCC) has prepared relative sea level projection models by 2100 in their Fifth Assessment Report (AR5). The models include different geophysical components, which are 5 ice components, 3 ocean-related components, land water storage, and glacial isostatic adjustment [18,19]. These models are the sea level projections over the 21st century according to three different climate scenarios, which are analyzed in more detail in this article.
Sea level rise can be further divided into relative and absolute depending on the chosen reference surface. Relative sea level change refers to the Earth’s crust at a particular location, i.e., it shows how the height of the sea level rises or falls relative to the land. In contrast, absolute sea level change refers to the height of the sea level above the center of the Earth, which is more precisely relative to the chosen terrestrial reference frame, like the International Terrestrial Reference Frame (ITRF), where the potential vertical motion of nearby land is eliminated [20].
The predominant long-term effect of relative sea level change in the Baltic Sea is caused by glacial isostatic adjustment and global mean sea level rise. Glacial isostatic adjustment is a process that involves the rise of the Earth’s crust due to its release from the ice cover approximately 10,000 years ago [21]. Several land uplift models have been developed for the Baltic Sea region [22,23,24,25,26,27], and among the most recent is NKG2016LU [28]. The vertical crustal movement of the ground in the northern part of the Baltic Sea is estimated to be about 10 mm/yr, and in the southern part of the Baltic Sea, about 0 mm/yr [28]. Consequently, the relative sea level rise is higher in the southern part of the Baltic Sea and lower in the northern part.
The rise in global mean sea level is generally caused by the addition of water from the melting of glaciers [21,29] and the general thermal expansion of seawater induced by global warming [30]. It is estimated that the global mean sea level rise during the 20th century was between 1 and 2 mm/yr [31], but since 1991, ascertained using satellite altimetry, it has been estimated that the global mean sea level rise has been 3–4 mm/yr [31,32,33,34]. However, in terms of the rate of global mean sea level rise, an accelerating rate can be seen from satellite altimetry data. For example, from 1993–2002, the rate of global mean sea level rise was 2.27 mm/yr, and recent measurements in 2013–2022 show a global mean sea level rise of 4.62 mm/yr [35], suggesting that the rate of sea level rise has doubled.
This review paper has been given practical value by incorporating different sea level and land uplift models to better understand the relative sea level rise in the Baltic Sea and how it affects the Baltic Sea area. The uniqueness of the research is expressed in the fact that land uplift models have rarely been used to study sea level changes in previous studies, but their use provides an opportunity to more thoroughly analyze sea level change. Moreover, the focus of the study is on the coastal area of Estonia, to compare the previous studies and IPCC AR5 scenarios with previous local (high-resolution) models. However, compared to the changes in the sea level in the Baltic Sea region and the changes in the global mean sea level, similar changes can be observed in the Baltic Sea region over the same period. A more detailed overview of the study of sea level changes in the Baltic Sea can be found in the section “Sea Level Trends in the Baltic Sea” of this article.
The main objectives of this paper are:
- To provide an overview of sea level rise in the Baltic Sea based on different studies where tide gauges, satellite altimetry, and sea level rise model data were used;
- To verify the absolute sea level rise values at the coast of the Baltic Sea using sea level rise models and determine the relative sea level rise in the coastal area of the Baltic Sea, the rates from land uplift models were compared to absolute sea level rise models.
The paper is arranged as follows: Section 2 gives an overview of sea level trends in the Baltic Sea based on tide gauges, satellite altimetry, and sea level models. Section 3 describes models of land uplift and the connection with sea level rise. In Section 4, an overview of relative sea level rise in the Baltic Sea and coastal area of Estonia based on absolute sea level rise and land rise models is presented. Section 5 shows projections of relative sea level rise in the Baltic Sea and coastal area of Estonia for the year 2100 based on the IPCC AR5 climate scenarios and presents ESA’s sea level and EST2020VEL land uplift models. Finally, Section 6 summarizes the findings.
2. Sea Level Trends in the Baltic Sea
2.1. Sea Level Observations
2.1.1. Tide Gauges
Two data types have been utilized to measure the sea level in the Baltic Sea: tide gauges and satellite altimetry. The traditional method to measure the sea level is to use tide gauges, where the sea level at a tide gauge station is measured mechanically (older method) or digitally (newer). As tide gauges are installed in the ground at the coast, they are affected by different ground movements, such as glacial isostatic adjustment. Hence, as the land moves, the tide gauge moves with it too. As a result, it is possible to monitor only the relative sea level change through tide gauges.
Tide gauges have been used to measure the sea level in the Baltic Sea since 1774 (the first mareograph in Stockholm, [36]). From the early 19th century, continuous measurements were conducted in various regions of the Baltic Sea through the installation of several tide gauges along the coasts of Sweden and Finland. The establishment of the first mareograph in Estonia took place in Tallinn in 1842. Subsequently, in the 1880s, regular sea-level observations began in other tide gauges located in Estonia [37].
However, how accurately the sea level is measured at the tide gauges depends on the technology used there. It is possible to use water measuring rods, mareographs, or various automatic stations. In tide gauges, where water measuring rods are used, the accuracy of tide gauges has been considered to be ±5 cm in calm seas and ±5 cm in stormy seas [38]. The accuracy of mareographs is estimated to be approximately 1 cm, but in the case of high-quality tide gauges used in the well system, the accuracy is estimated to be 2–4 mm [38,39]. In addition, it is also possible to use different automatic stations to measure the sea level, which use either acoustic water measuring devices, radars, or pressure sensors. The accuracy of sea level determination using these devices has also been estimated to be approximately ±1 cm [40].
Repositories of national sea level data are usually the national meteorological agencies; however, there are databases containing a collection of selected sea level data globally or regionally. For example, Copernicus Marine Service (http://www.marineinsitu.eu/, accessed on 15 May 2023) lists 150 active tide gauges, which effectively cover the entire coast of the Baltic Sea and provide at least 5 years of data (Figure 1).
Another service providing tide gauge sea level data is Permanent Service for Mean Sea Level (PSMSL) [42], a global database for long-term sea level information from tide gauges and bottom pressure recorders. Unfortunately, only historical data of two Estonian tide gauges (Tallinn and Vilsandi, 1928–1938) are included in the PSMSL at present. Starting in 2018, Estonia transitioned its height system to the European Vertical Reference System (EVRS), aligning it with the Normaal Amsterdams Peil (NAP) level. This change made Estonia’s height system more compatible with the PSMSL [43].
High-frequency (hourly and daily) sea level records are also available from organizations, such as the Global Extreme Sea Level Analysis Initiative (GESLA) [44], the Flanders Marine Institute (VIZ) [45], and the University of Hawaii-Sea-Level Central (UHSLC) [46]. All these databases are important as they enable the gathering of data from tide gauges located in the Baltic Sea. GESLA currently holds (January 2023) the largest collection of high-frequency sea level data. The current version of the database GESLA-3 contains a total of 90,713 years of sea level data from 5119 records all over the world. In this database, the number of tide gauges aggregated for the Baltic Sea is similar to that presented by Copernicus Marine Service.
2.1.2. Satellite Altimetry
Since the early 1990s, sea level change has also been monitored through satellite altimetry [47], which allows sea level to be measured more dynamically across all seas. Satellite altimetry enables an accurate determination of sea level elevation relative to the Earth’s center of mass and the rate and acceleration of sea level change based on sea level time series [48]. Over the past thirty years, several satellite altimetry missions have been launched into orbit, with the longest time series being TOPEX/Poseidon (1992–2005). The descendants of this satellite are Jason-1 (2002–2012), Jason-2 (2008–2019), and Jason-3 (2016–) [49]. In Europe, the first satellite altimetry mission ERS-1 was launched in 1991. Since then, ERS-2, AltiKa, CryoSat-2, Sentinel-3A/3B, and Sentinel-6 have been launched in Europe. All missions are essential to study global sea level change.
The dense network of in situ tide gauges in the Baltic Sea also supports satellite altimetry studies because tide gauges data allow for efficient validation of satellite altimetry data; for example, as a result of the validation of the Sentinel-3A and Sentinel-3B Level-2 altimetry products along the Estonian coast. Liibusk et al. [50] found that satellite altimetry can determine the height of the sea level in Estonian coastal areas with an average accuracy of 80 ± 70 mm. Sentinel-3 Level-2 sea level altimetry products and 2019 data were used in this study. Liebsch et al. [51] compared observations from two tide gauge stations and sea-surface heights derived from altimeter missions, such as Geosat, ERS-1, ERS-2, and TOPEX/Poseidon. Their analysis yielded absolute altimeter biases of −243 ± 32 mm for Geosat, 467 ± 19 mm for ERS-1, 76 ± 19 mm for ERS-2, and 13 ± 18 mm for TOPEX.
2.2. Sea Level Trends in the Baltic Sea
In the past three decades, the sea level change in the Baltic Sea has been studied by various research groups, using data from tide gauges and satellite altimetry to study sea level rise. However, there are some differences between the two aforementioned methods when studying sea level changes. The comparison of sea level rise from these two methods is slightly limited due to different observation periods and analysis techniques.
2.2.1. Tide Gauges Data
As mentioned above, the spatiotemporal distribution of tide gauges in the Baltic Sea region is dense. Therefore, several studies have been carried out to analyze sea level changes. As sea level is affected by many forces that cause short-term and seasonal variations of the sea level, the current paper focuses only on long-term or secular trends of the Baltic Sea level. Relative sea level change (i.e., apparent land uplift with opposite sign) RSLR observed by tide gauges (Δm) reflect the combined effect of vertical crustal deformations (mainly due to GIA, (Δr)) and eustatic sea-level rise (Δe). Here, the term eustatic sea level rise can be understood as the global volume change of ocean water [52]. To obtain absolute sea level rise (SLR), i.e., (Δm) relative to Earth’s center of mass, geoid change (Δg) also needs to be accounted for. Therefore, absolute sea level rise relative to Earth’s mass center can be expressed as:
SLR = Δr + Δe + Δg.
Long-term changes in sea level can be studied using data from tide gauges because their time series are significantly longer than satellite altimetry. Table 1 presents the results of selected studies on sea level trends in the Baltic Sea based on tide gauges carried out over the past two decades. It shows the used data, the area, the time span, and the sea level trends during this period.
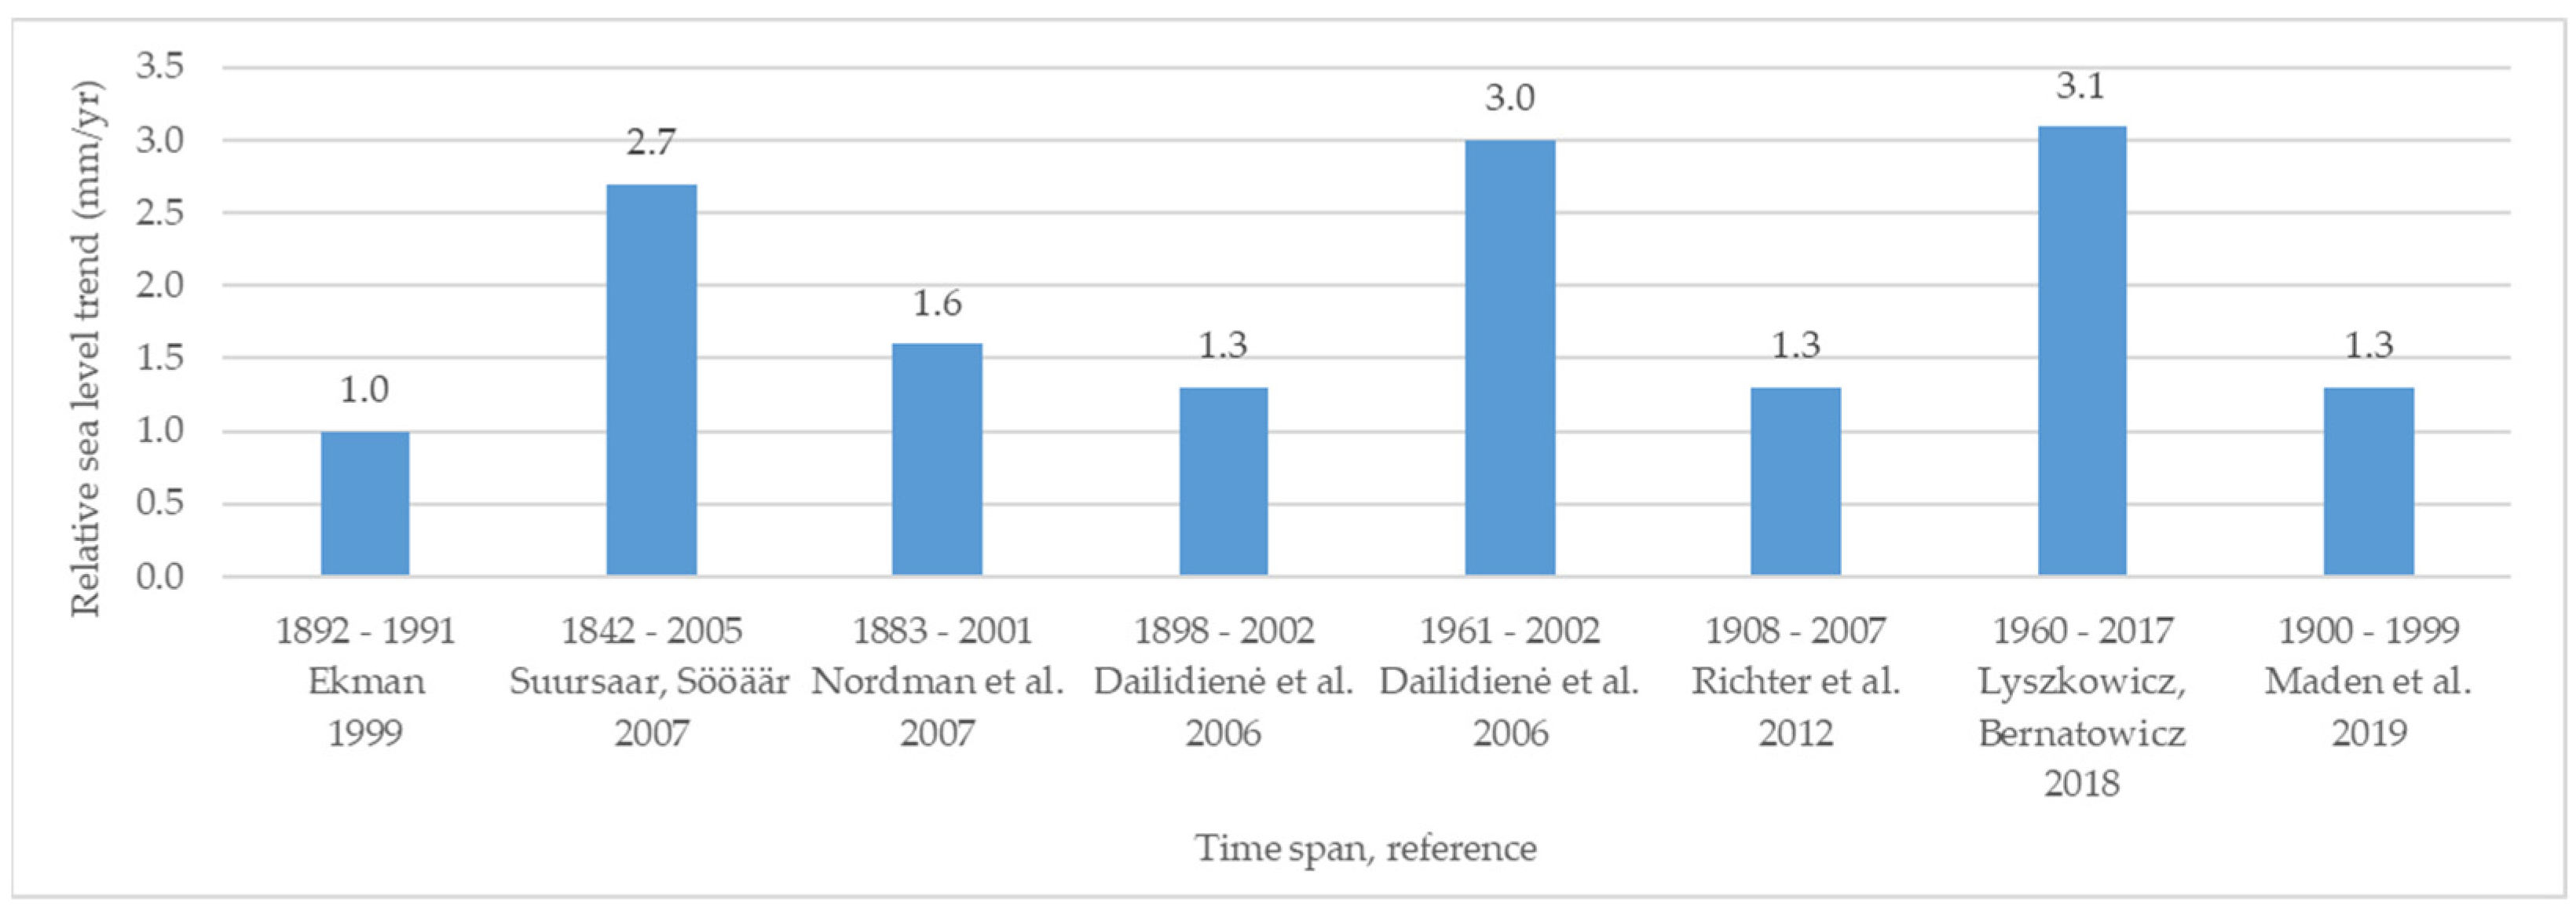
In addition, relative sea level trends found in various studies are presented in Figure 2, where the rate of sea level rise, time span, and references are shown.
The relative sea level measured at tide gauges is affected by vertical movements of the ground, which can be both local deformations and post-glacial land uplift. Therefore, it is difficult to estimate the actual sea level rise expressed as absolute sea level rise. For this purpose, Suursaar and Sooäär [54] used the land uplift model to find sea level rise. Nordman et al. [55] and Richter et al. [52] used GPS measurements and geoid values. Ekman [53] and Dailidienė et al. [56] analyzed data from tide gauges.
In the 20th century, the sea level rise in the Baltic Sea has been estimated from 1.0 to 1.6 mm/yr based on various studies [43,52,53,54,55,56]. More specific time periods and trends are shown in Table 1. The global sea level rise in the 20th century has been estimated to be between 1.0 to 2.0 mm/yr based on tide gauge data [59]. This shows that the sea level rise of the Baltic Sea is similar to the global sea level rise for the same period, though the sea level has not always risen at the same rate. Acceleration of sea level rise has been detected in the latter decades of the 20th century, which is also indicated by Dailidienė et al. [56] and Łyszkowicz, Bernatowicz [57]. For example, Dailidienė et al. [56] found, based on the data of tide gauges, that in the years 1961–2002, the sea level rose in all tide gauges in Lithuania by about 3.0 mm/yr, while an average sea level rise was 1.3 mm/yr for the entire 20th century. Łyszkowicz and Bernatowicz [57] found that sea level rise in 1960–2017 was 3.09 mm/yr based on tide gauges, which they compared to sea level rise based on satellite altimetry (Table 2).
2.2.2. Satellite Altimetry Data
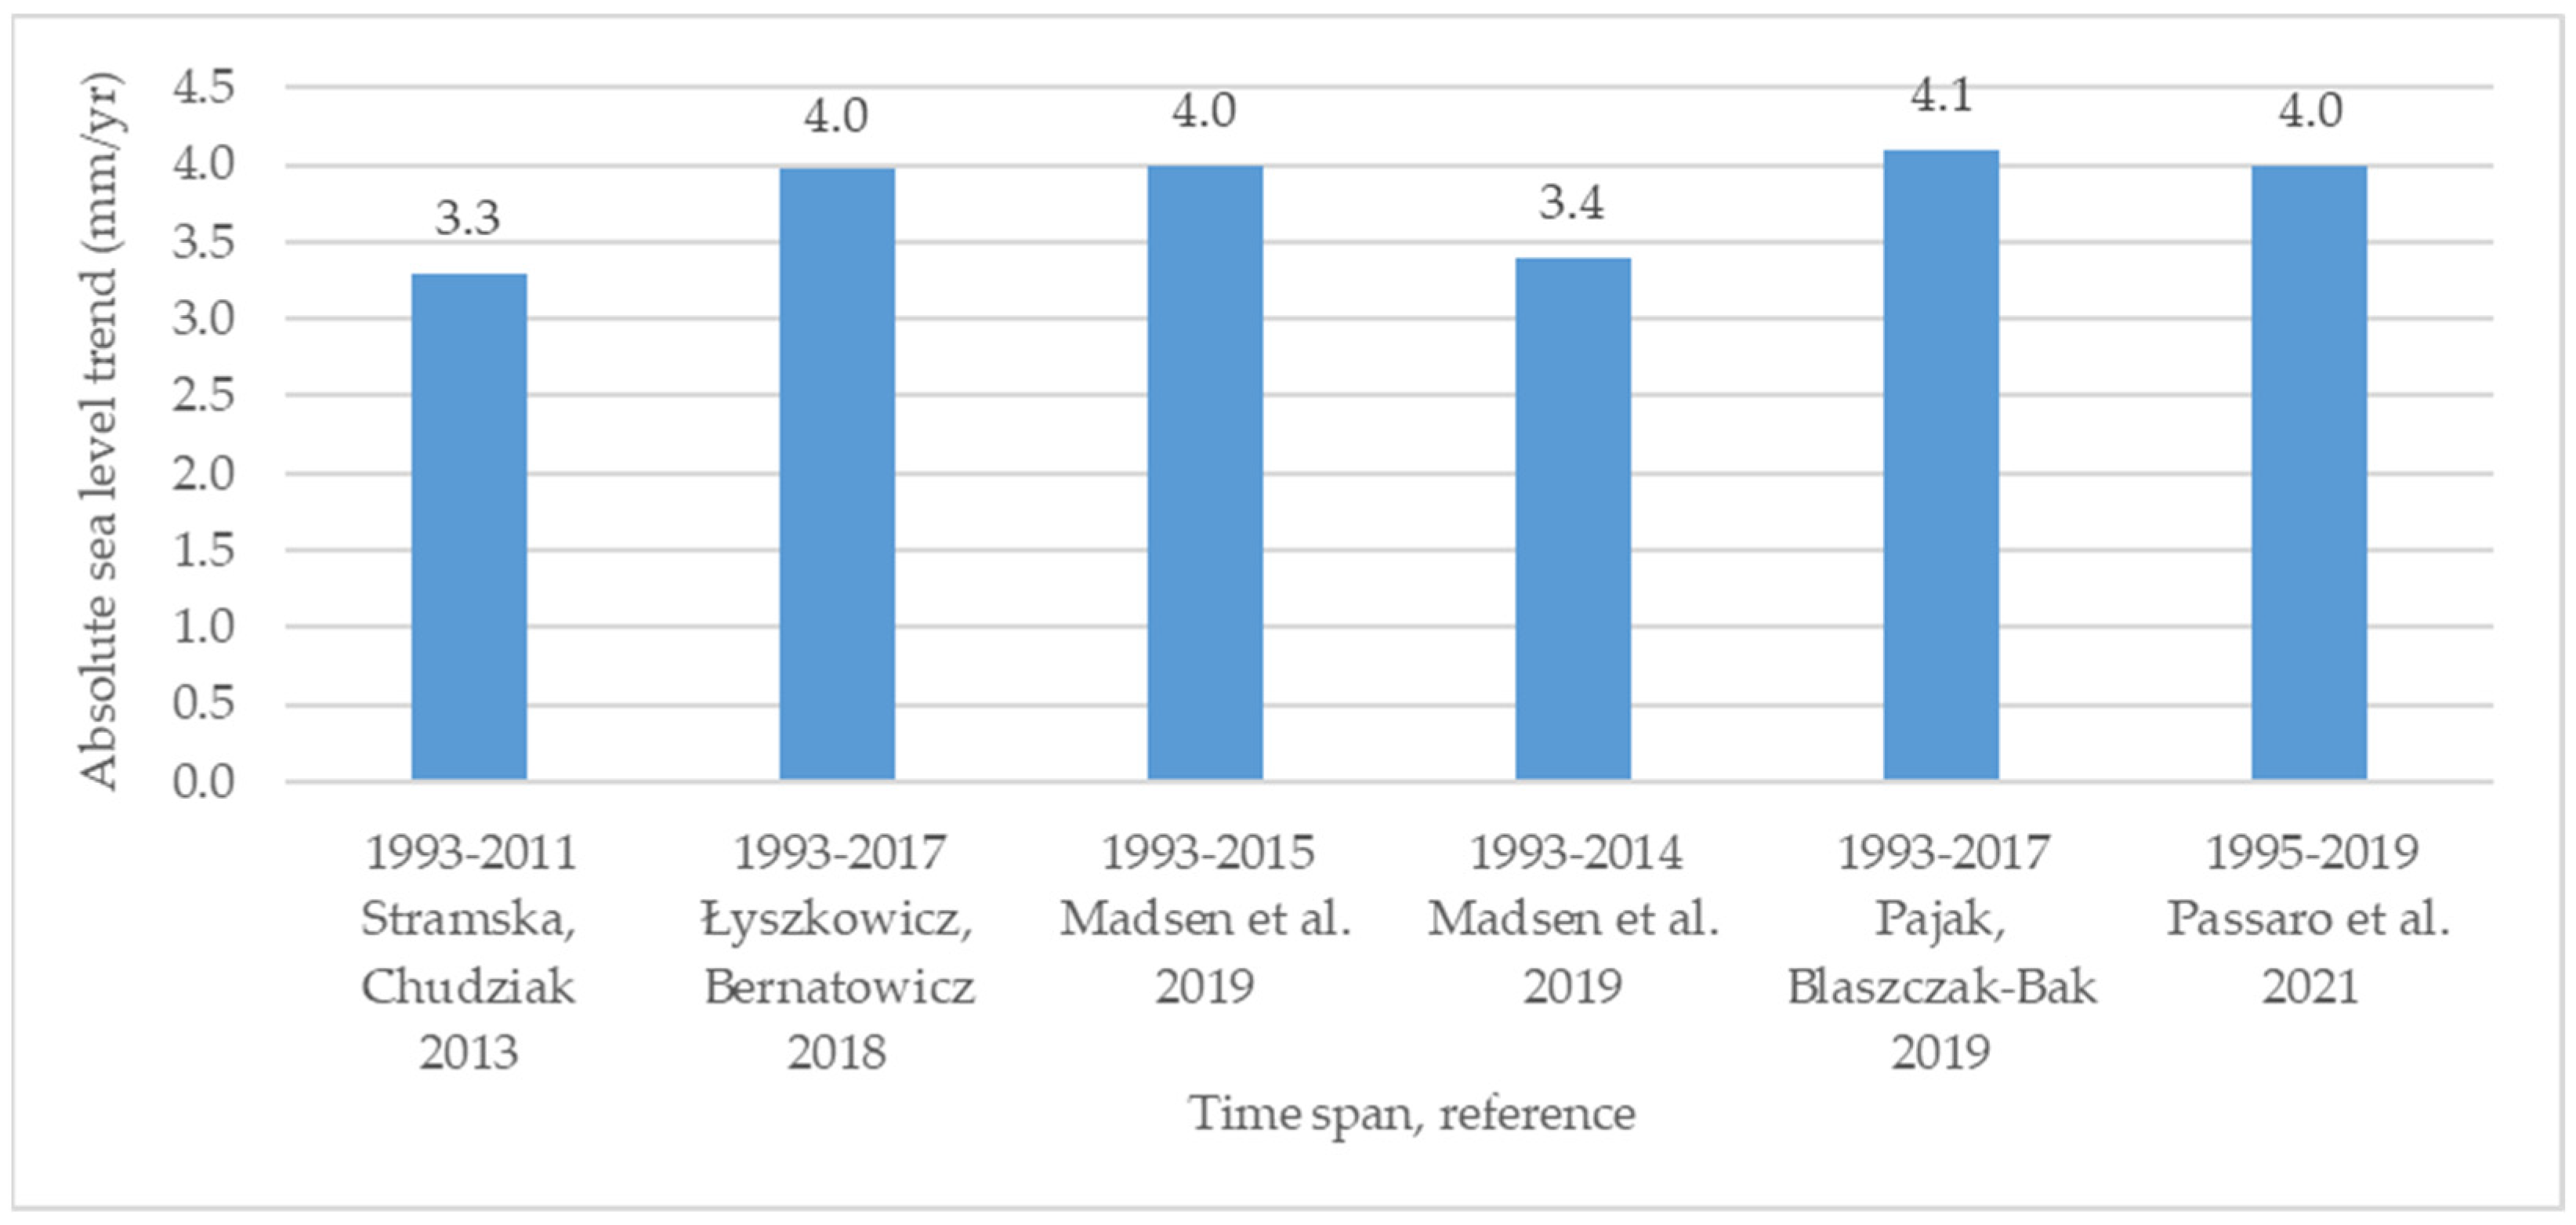
While it has been possible to measure the sea level based on the tide gauges on a scale of centuries, satellite altimetry is a rather modern method for measuring the sea level. Table 2 shows the results of different studies of sea level change in the Baltic Sea based on satellite altimetry, where the used data, time span, and sea level trends during that period are presented.
In addition, absolute sea level trends found in various studies are presented in Figure 3, where the rate of sea level rise, time span, and references are shown.
Although the first satellite altimetry mission data date back to the early 1990s, initially, these data were not thoroughly applied to the study of sea level rise in the Baltic Sea. Satellite altimetry data have been widely used in determining the rate of sea level rise, mostly in the last two decades. Since the time series were initially quite short, the satellite altimetry data were compared with other sea level measurements [51,63,64,65,66,67].
Satellite altimetry measurements have been applied more thoroughly in the last decade to study the sea level rise of the Baltic Sea. Table 2 shows that data from all main satellite altimetry missions have been used in various studies, such as TOPEX-Poseidon, Jason-1, Jason-2, ERS-1, ERS-2, Envisat, SARAL, Cryosat-2, Sentinel-3A, and Sentinel-3B. Studies using satellite altimetry data from 1993 to 2019 have found that the mean sea level rise in the Baltic Sea is between 3.3 and 4.1 mm/yr [43,57,60,61,62]. In addition, Madsen et al. [43] constructed sea level rise by combining data from century-long tide gauge records with results from hydrodynamic modeling based on atmospheric reanalysis data. Reconstructed sea level rise was 3.4 ± 0.7 mm/yr from 1993–2014.
2.2.3. Sea Level Models
Different sea level measurements are crucial and enable scientists to create models of sea level. To study sea level changes, there are different models, for example, HIROMB-BOOS, SWAN, or BALTSEM. HIROMB-BOOS (high-resolution operational model for the Baltic Sea–Baltic Operational Oceanographic System) is an operational oceanographic model focusing on the Baltic Sea region. It incorporates hydrodynamic and biogeochemical processes to simulate sea level variations, water circulation, and ecosystem dynamics [68]. SWAN (simulating waves nearshore) is a wave model frequently used to study wave dynamics and related sea level changes in coastal regions, including the Baltic Sea. It focuses on simulating wave heights, wave directions, and wave-induced coastal processes [69]. BALTSEM (Baltic Sea model) is a widely used coupled physical-biogeochemical model specifically designed for the Baltic Sea. It incorporates processes such as tides, wind-driven currents, temperature, salinity, and atmospheric forcing to simulate sea level changes and understand the impacts of climate change [70]. As you can see, different models have different purposes.
To analyze how the sea level has changed over time, it is possible to use models that use real data and not prognoses. For example, there is a model developed in the BalticSEAL project by ESA [62,71], which was calculated by using Jason, Envisat, CryoSat, and Sentinel-3 satellite altimetry data. It is an absolute sea level trend model from 1995 to 2019. The absolute sea level rise from 1995 to 2019 was 2.4 to 6.5 mm/yr in the Baltic Sea (Table 2, Figure 4).
As mentioned in the introduction, the IPCC AR5 sea level projections over the 21st century have different climate scenarios. These scenarios are associated with the representative concentration pathways (RCPs), representing different future radiative forcing scenarios. Radiative forcing measures the imbalance between incoming and outgoing energy in the Earth’s atmosphere, primarily caused by greenhouse gases and other factors. The AR5 report considered four RCP scenarios: RCP2.6, RCP4.5, RCP6.0, and RCP8.5. These scenarios correspond to different levels of radiative forcing in the year 2100, expressed in Watts per square meter (W/m²). The RCPs provide a range of possible future greenhouse gas emissions and concentrations based on different socioeconomic and climate policy assumptions. Here are the approximate radiative forcing levels associated with the RCP scenarios in the year 2100. These are RCP2.6 (approximately 2.6 W/m²), RCP4.5 (approximately 4.5 W/m²), RCP6.0 (approximately 6.0 W/m²) and RCP8.5 (approximately 8.5 W/m²) [18,19]. However, sea level projection models have been prepared for three RCP scenarios, which are RCP2.6, RCP4.5, and RCP8.5. The IPCC has outlined the following for the three scenarios:
- RCP2.6: This scenario assumes that CO2 emissions will reach their peak around 2020 and subsequently decline to zero by 2100. It is designed to achieve global warming levels below 2 °C;
- RCP4.5: In this scenario, CO2 emissions are expected to peak around 2040 and then gradually decline. The projected global warming falls between 2 °C and 3 °C;
The ESA’s BalticSEAL and IPCC AR5 models are used in this research to study in more detail the relative sea level rise in the Baltic Sea. The ESA’s model makes it possible to study the relative sea level rise between 1995 and 2019. This model was used because it offers good spatio-temporal resolution (1 arcminute resolution grid and timespan 1995–2019). Also, one of the advances of this model is that it also offers uncertainties of the sea level trends with the same spatial resolution. In addition, the model is validated against tide gauge data, and very good results were achieved (RMS 1.41 mm/yr) [72]. The IPCC AR5 climate scenario models make it possible to analyze what the relative sea level rise will be by the year 2100 compared to the ESA’s model.
3. Land Uplift Models
The impact of sea level rise on the coastal areas of the Baltic Sea has been significantly affected by post-glacial land uplift. The connection between land uplift and sea level rise has also become relevant due to climate change and the associated acceleration of global sea level rise.
The nature of the post-glacial land uplift is known and widely studied. This concerns the fact that the land has been uplifting since the end of the last ice age to the present day and will continue to rise in the future. Based on various calculations and models, it has been established that the land in the Baltic Sea region has not reached the pre-ice age level yet; therefore, the ground will continue to uplift in the future [73].
In the Baltic Sea area, the post-glacial land uplift has been thoroughly studied. Over the years, several land uplift models have been prepared for the Baltic Sea area to know the spatial change of the land in the region [22,23,24,25,26,27,28].
One of the latest land uplift models, the NKG2016LU (Figure 5), has compiled combining empirical observations (GNSS, leveling) with the theoretical GIA model. It is an official land uplift model of the Nordic Commission of Geodesy (NKG) [28]. It is known for its high accuracy within the Nordic and Baltic countries. The model’s accuracy can vary depending on the specific location and the quality and density of the underlying data used in its development. However, Vestøl et al. [28] pointed out a standard error of better than 0.25 mm/yr for most of the area covered by precise leveling or uplift rates from continuously operating reference stations, and up to 0.7 mm/yr outside this area.
Post-glacial land uplift in the Gulf of Riga is near zero, i.e., virtually non-existent, but it is much higher in the northern part of the Gulf of Bothnia, at around 10 mm/yr [28]. The main reason for the difference in land uplift in different regions is that the ice load was heavier in the north and, as a result, the land uplift is higher today [65].
The post-glacial land uplift has been studied in Estonia for over 50 years using various data, such as repeated leveling data [58,74,75], sea-level observations [76,77], and global navigation satellite system (GNSS) data, obtained from either continuously operating GNSS stations (CORS) or campaign data [78,79]. There are no significant differences between these studies. Using different methods, it has been found that the land uplift in the territory of Estonia ranges from −1 to 3 mm/yr.
The land uplift model EST2020VEL has been made specifically for the Estonian area [76], a new 3D velocity model of Estonia based on a combination of GNSS measurements and the NKG2016GIA model [28]. It used data from ten GNSS permanent stations whose time series are longer than ten years and the repeated GPS measurements from 1st order points of the national geodetic network from 1997, 2008, and 2017. Using the data, both vertical and horizontal movements were found for 22 points located all over Estonia. Based on the obtained velocities, the digital model EST2020VEL was modeled (Figure 6).
It can be seen from the model that the absolute vertical movement of the ground in the coastal area of Estonia is in the range of 1.25 to 3.5 mm/yr (Figure 6).
The advantage of using absolute land uplift models in studying sea level rise is that these rates are relative to the Earth’s center of mass, i.e., geocentric. Therefore, rates of land uplift are independent of global sea level rise. The models are also effectively used to eliminate the effects of post-glacial land uplift from absolute sea level rise. As a result, it is possible to find a relative, i.e., apparent sea level rise.
In addition, it is important to note that sea level rise is not spatially uniform across the region and may vary depending on the land uplift rate, dominant wind direction, average water temperature, salinity, etc. In areas where the land uplift is dominant over sea level rise, the effects of sea level rise are less severe than in areas where the land is not rising as quickly as the sea level.
4. Relative Sea Level Rise in the Baltic Sea
In this study, the relative sea level rise of the Baltic Sea was determined and analyzed using different absolute land uplift (NKG2016LU and EST2020VEL) and sea level rise (ESA’s BalticSEAL) models. These models cover the entire Baltic Sea and the Estonian area, respectively.
ArcGIS Pro software was used to calculate, analyze, and visualize the results. To interpolate the relative sea level rise, the Kriging method was used in ArcGIS Pro, and the relative sea level rise (RSLR) was calculated by the formula:
where SLR represents the absolute sea level rise (mm/yr) (Equation (1))and LU represents the absolute land uplift (mm/yr) at a given point that includes vertical crustal deformations (mainly due to GIA, (Δr), and geoid changes (Δg)):
RSLR = Δm = SLR − LU.
LU = Δr = Δm + Δe + Δg.
4.1. Coastal Area of the Baltic Sea
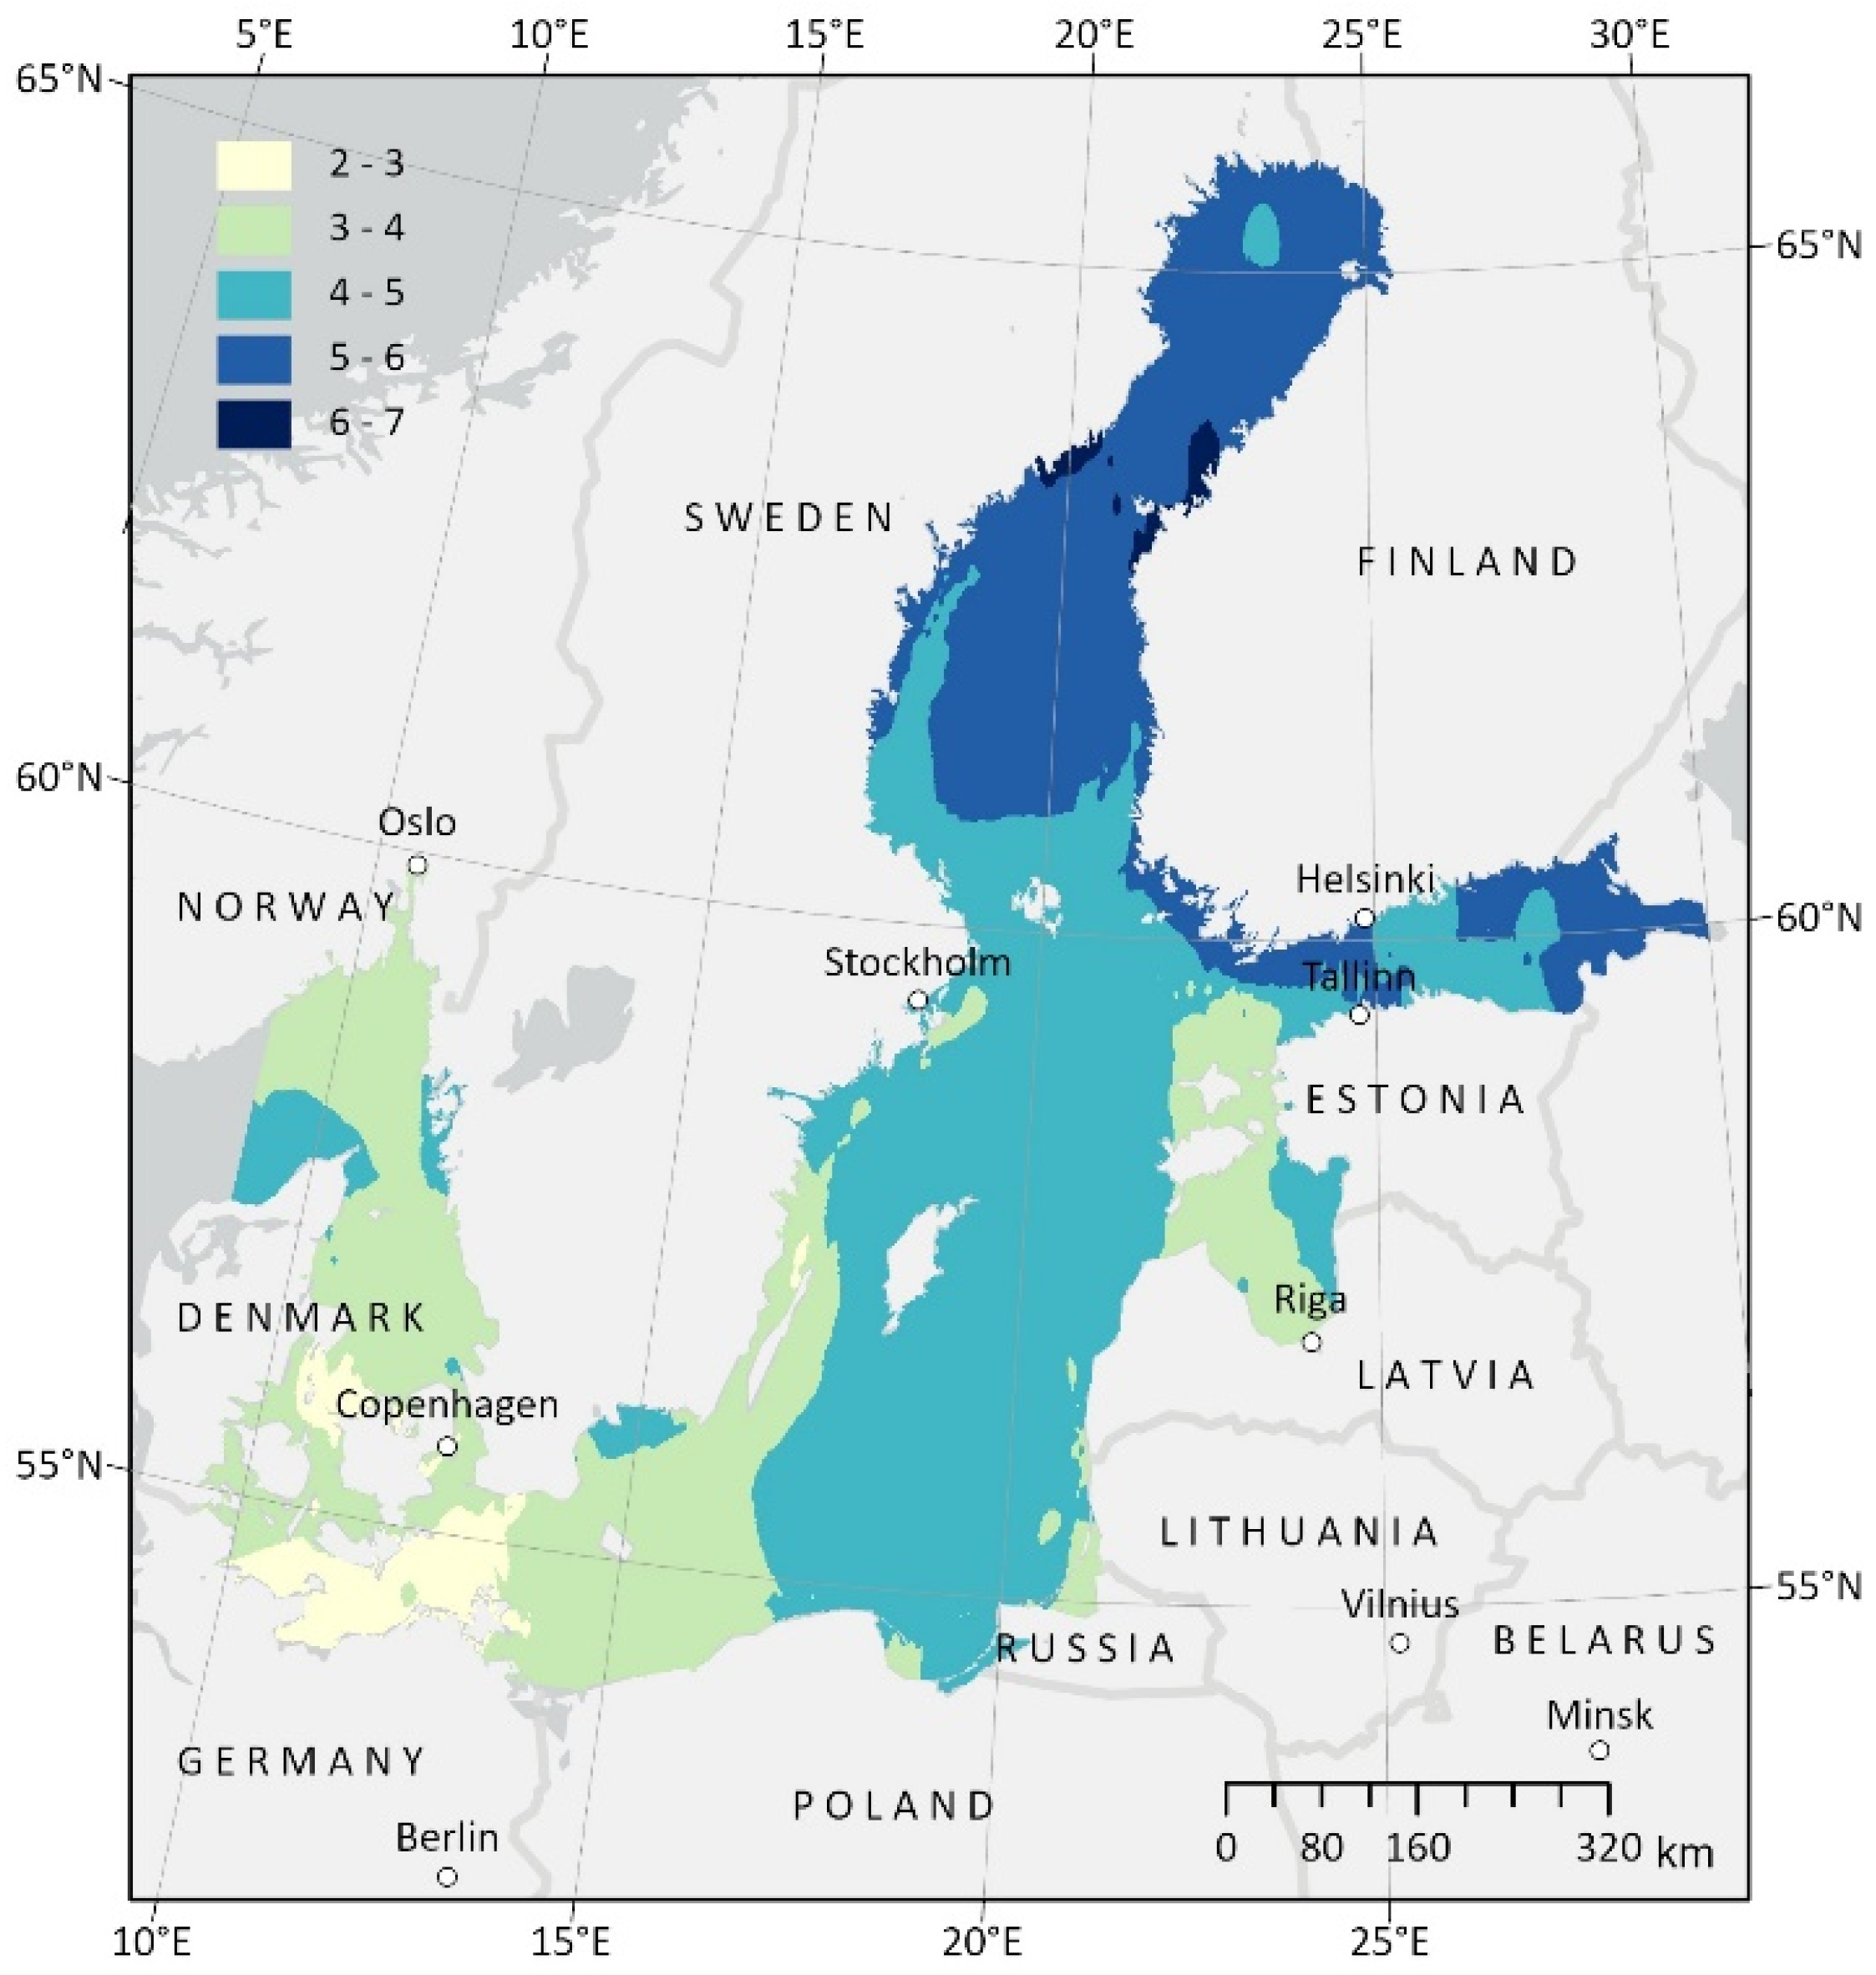
The relative sea level rise in the Baltic Sea area varies greatly. The study found that between 1995 and 1995, the relative sea level rise of the Baltic Sea ranged from −5.0 to 4.5 mm/yr, based on the NKG2016LU and ESA BalticSEAL models (Figure 7).
It can be observed that the southern areas of the Baltic Sea are most affected by the relative sea level rise. In that area, the relative sea level rise in coastal areas ranges from 0 to 3 mm/yr in Estonia, Latvia, and Lithuania, from 1 to 3 mm/yr in Denmark and Germany, and from 3 to 4.5 mm/yr in Poland and Russia. In Sweden and Finland, the relative sea level rise is most variable in the south-north direction. The relative sea level rise on the coast of these countries ranges from −5 to 4 mm/yr and −5 to 2 mm/yr, respectively. The northern areas of the Baltic Sea, where Sweden and Finland are located, are less affected by the relative sea level rise. There, the relative sea level rise and fall can be –5 mm/yr. Therefore, this area is not threatened by relative sea level rise.
Comparing the relative sea level rise with previous studies where relative sea level has been found, a similarity can be noticed. For example, Dailidienė et al. [53] found that the relative sea level on the Lithuanian coast rose by 3 mm/yr from 1961 to 2002, and Łyszkowicz and Bernatowicz [54] found that the relative sea level rose by 3.09 mm/yr from 1960 to 2017. The results suggest that the relative sea level rise found is similar. For longer time series, relative sea level rise is slower, as shown in Table 1.
4.2. Coastal Area of Estonia
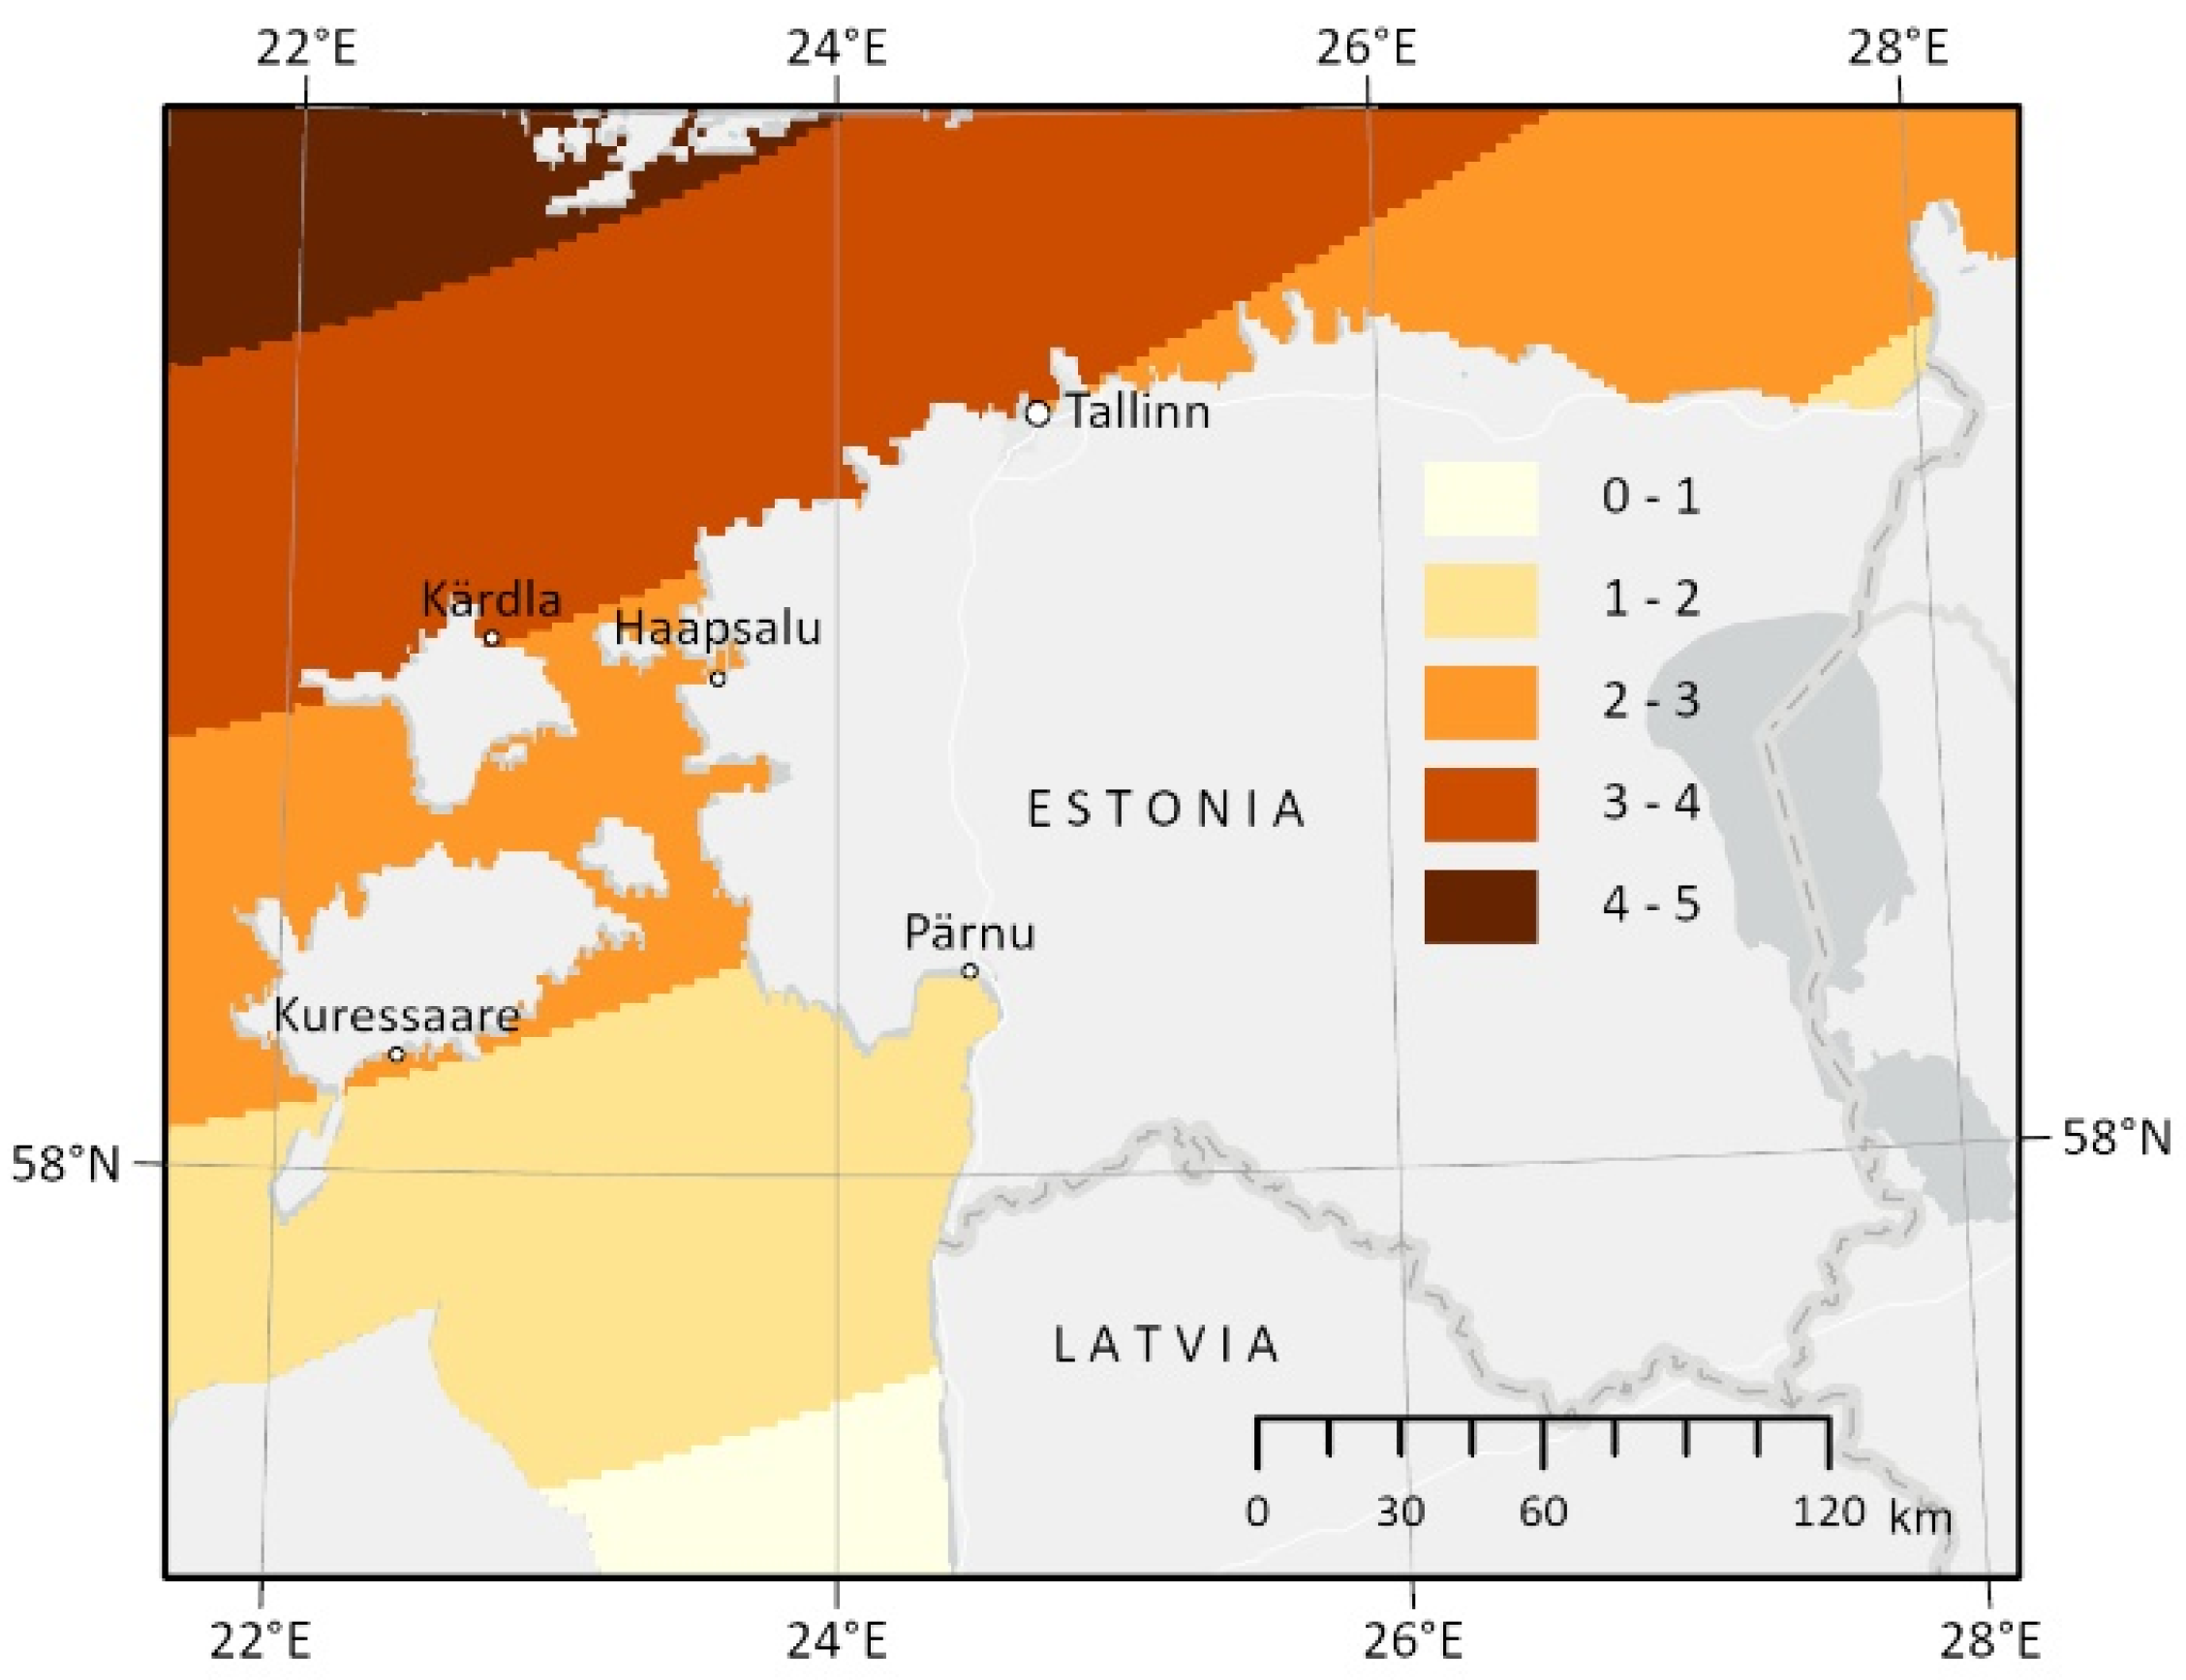
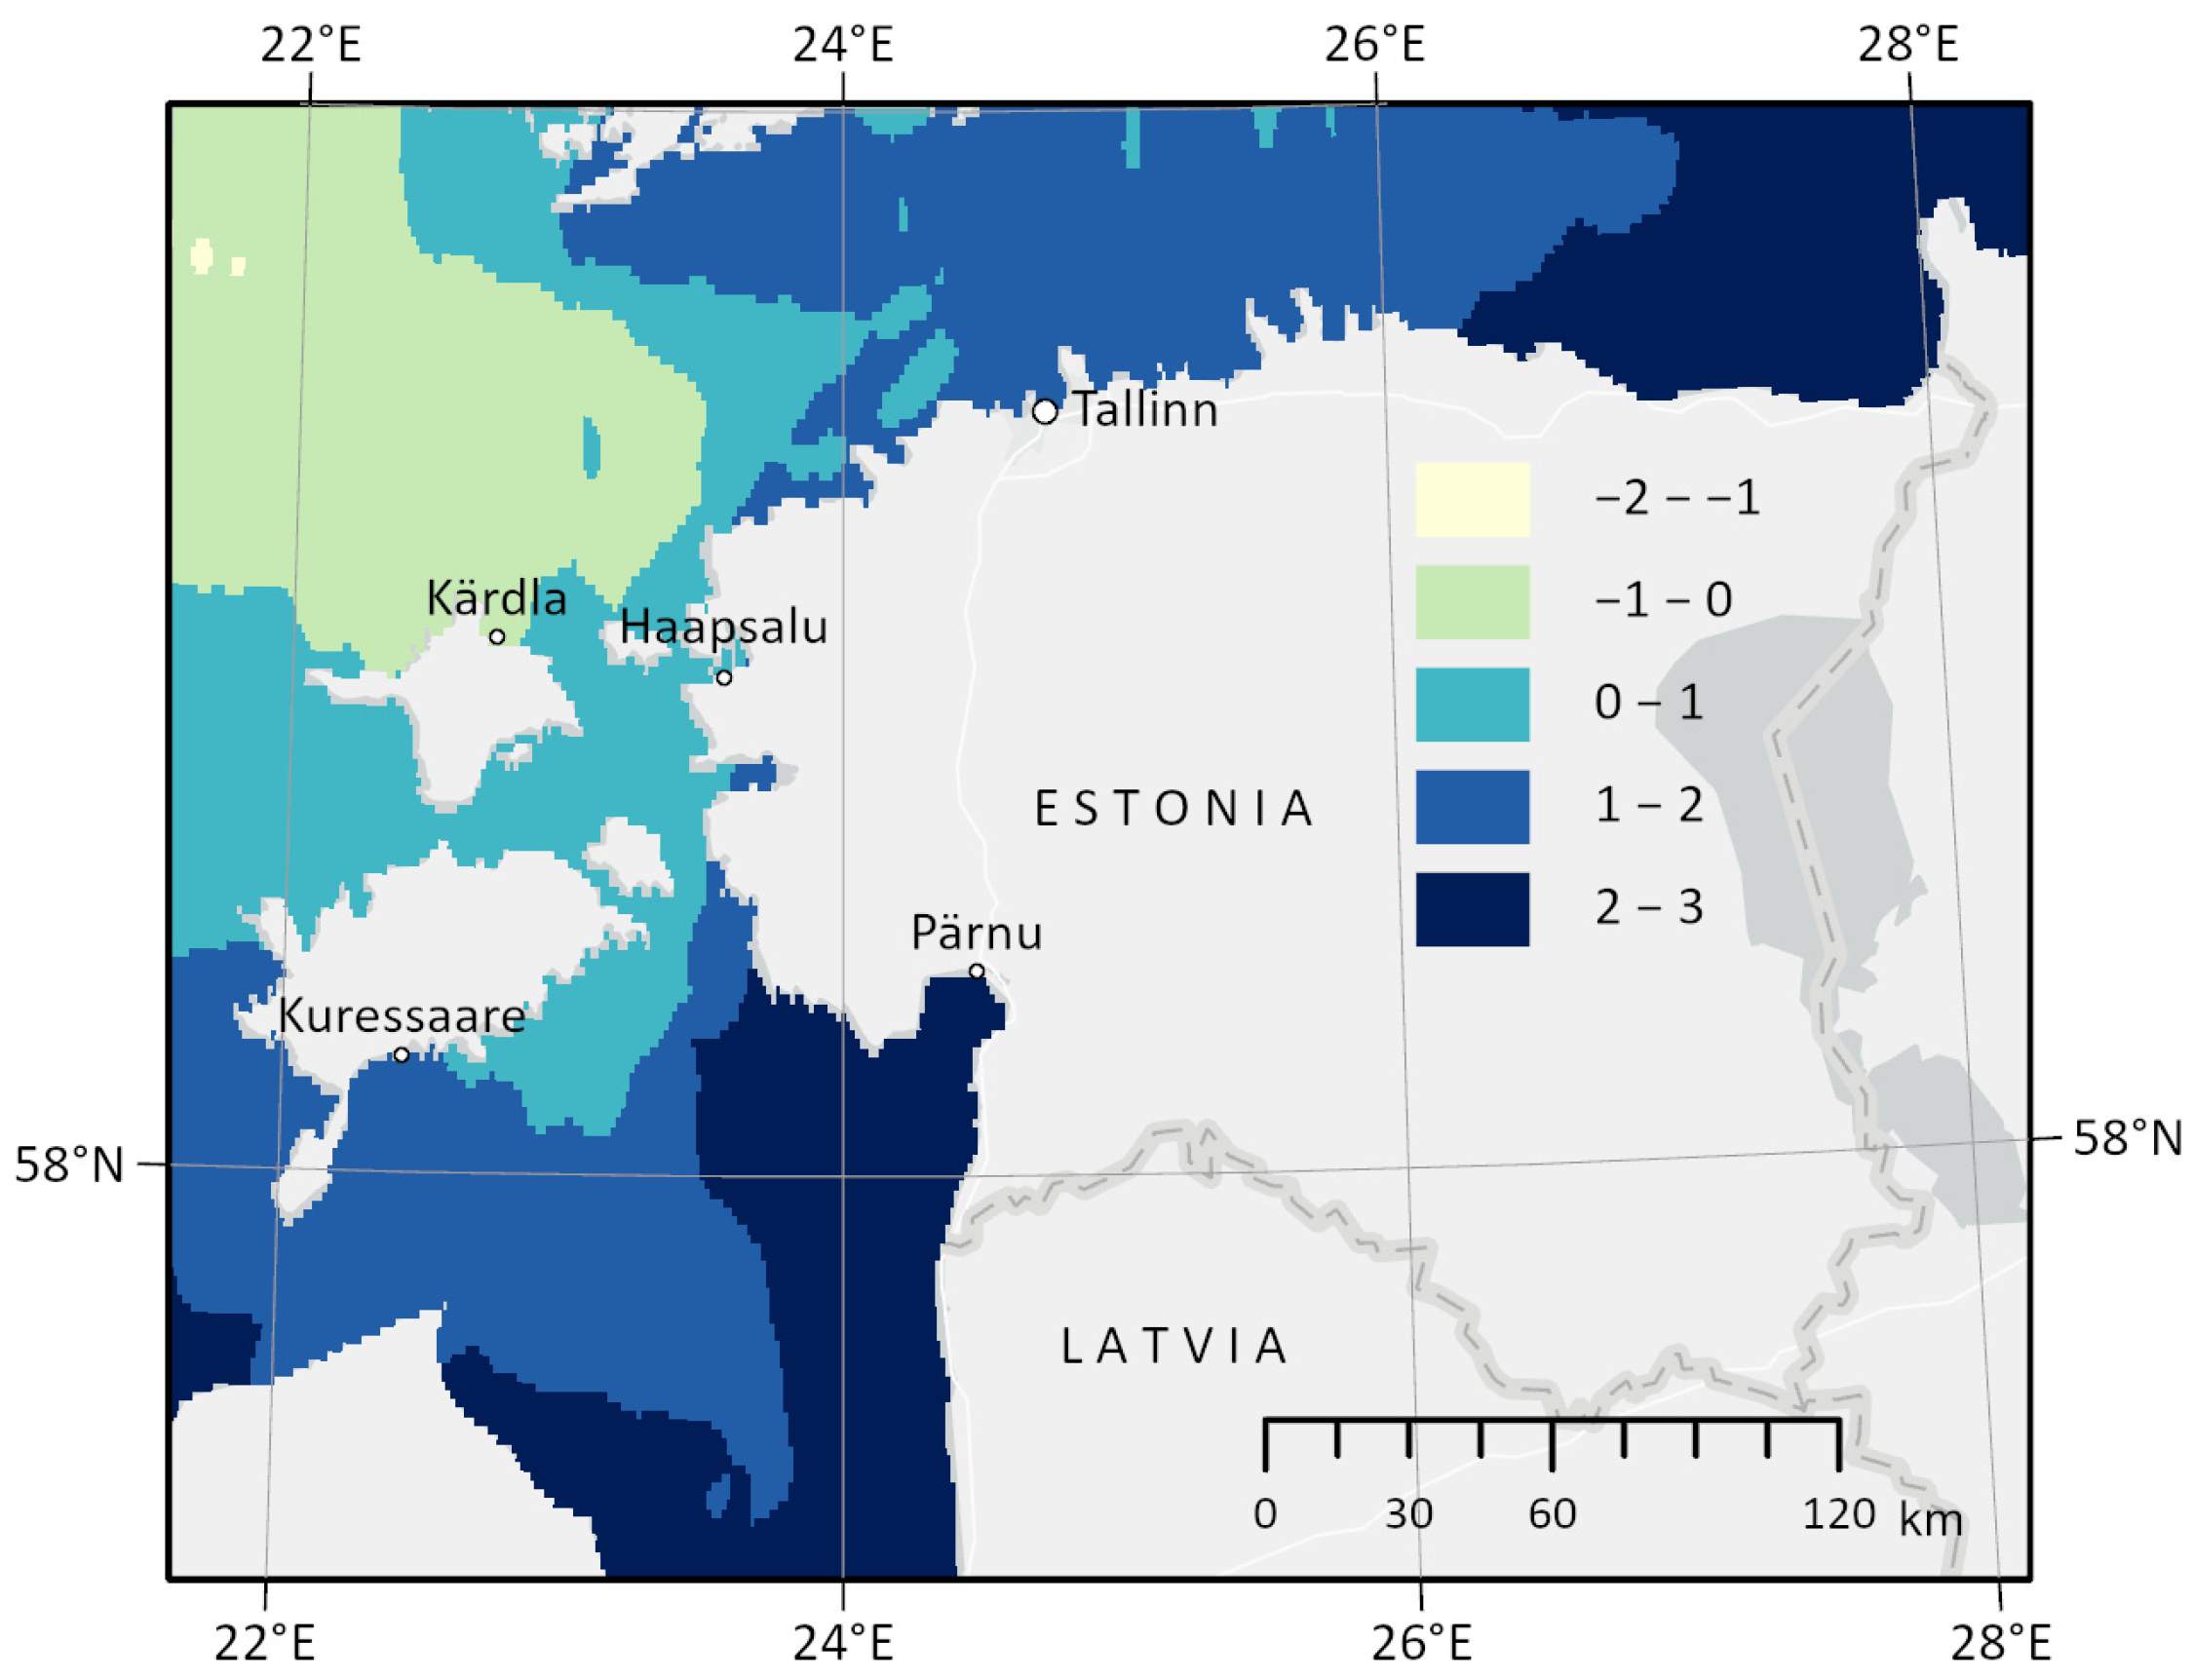
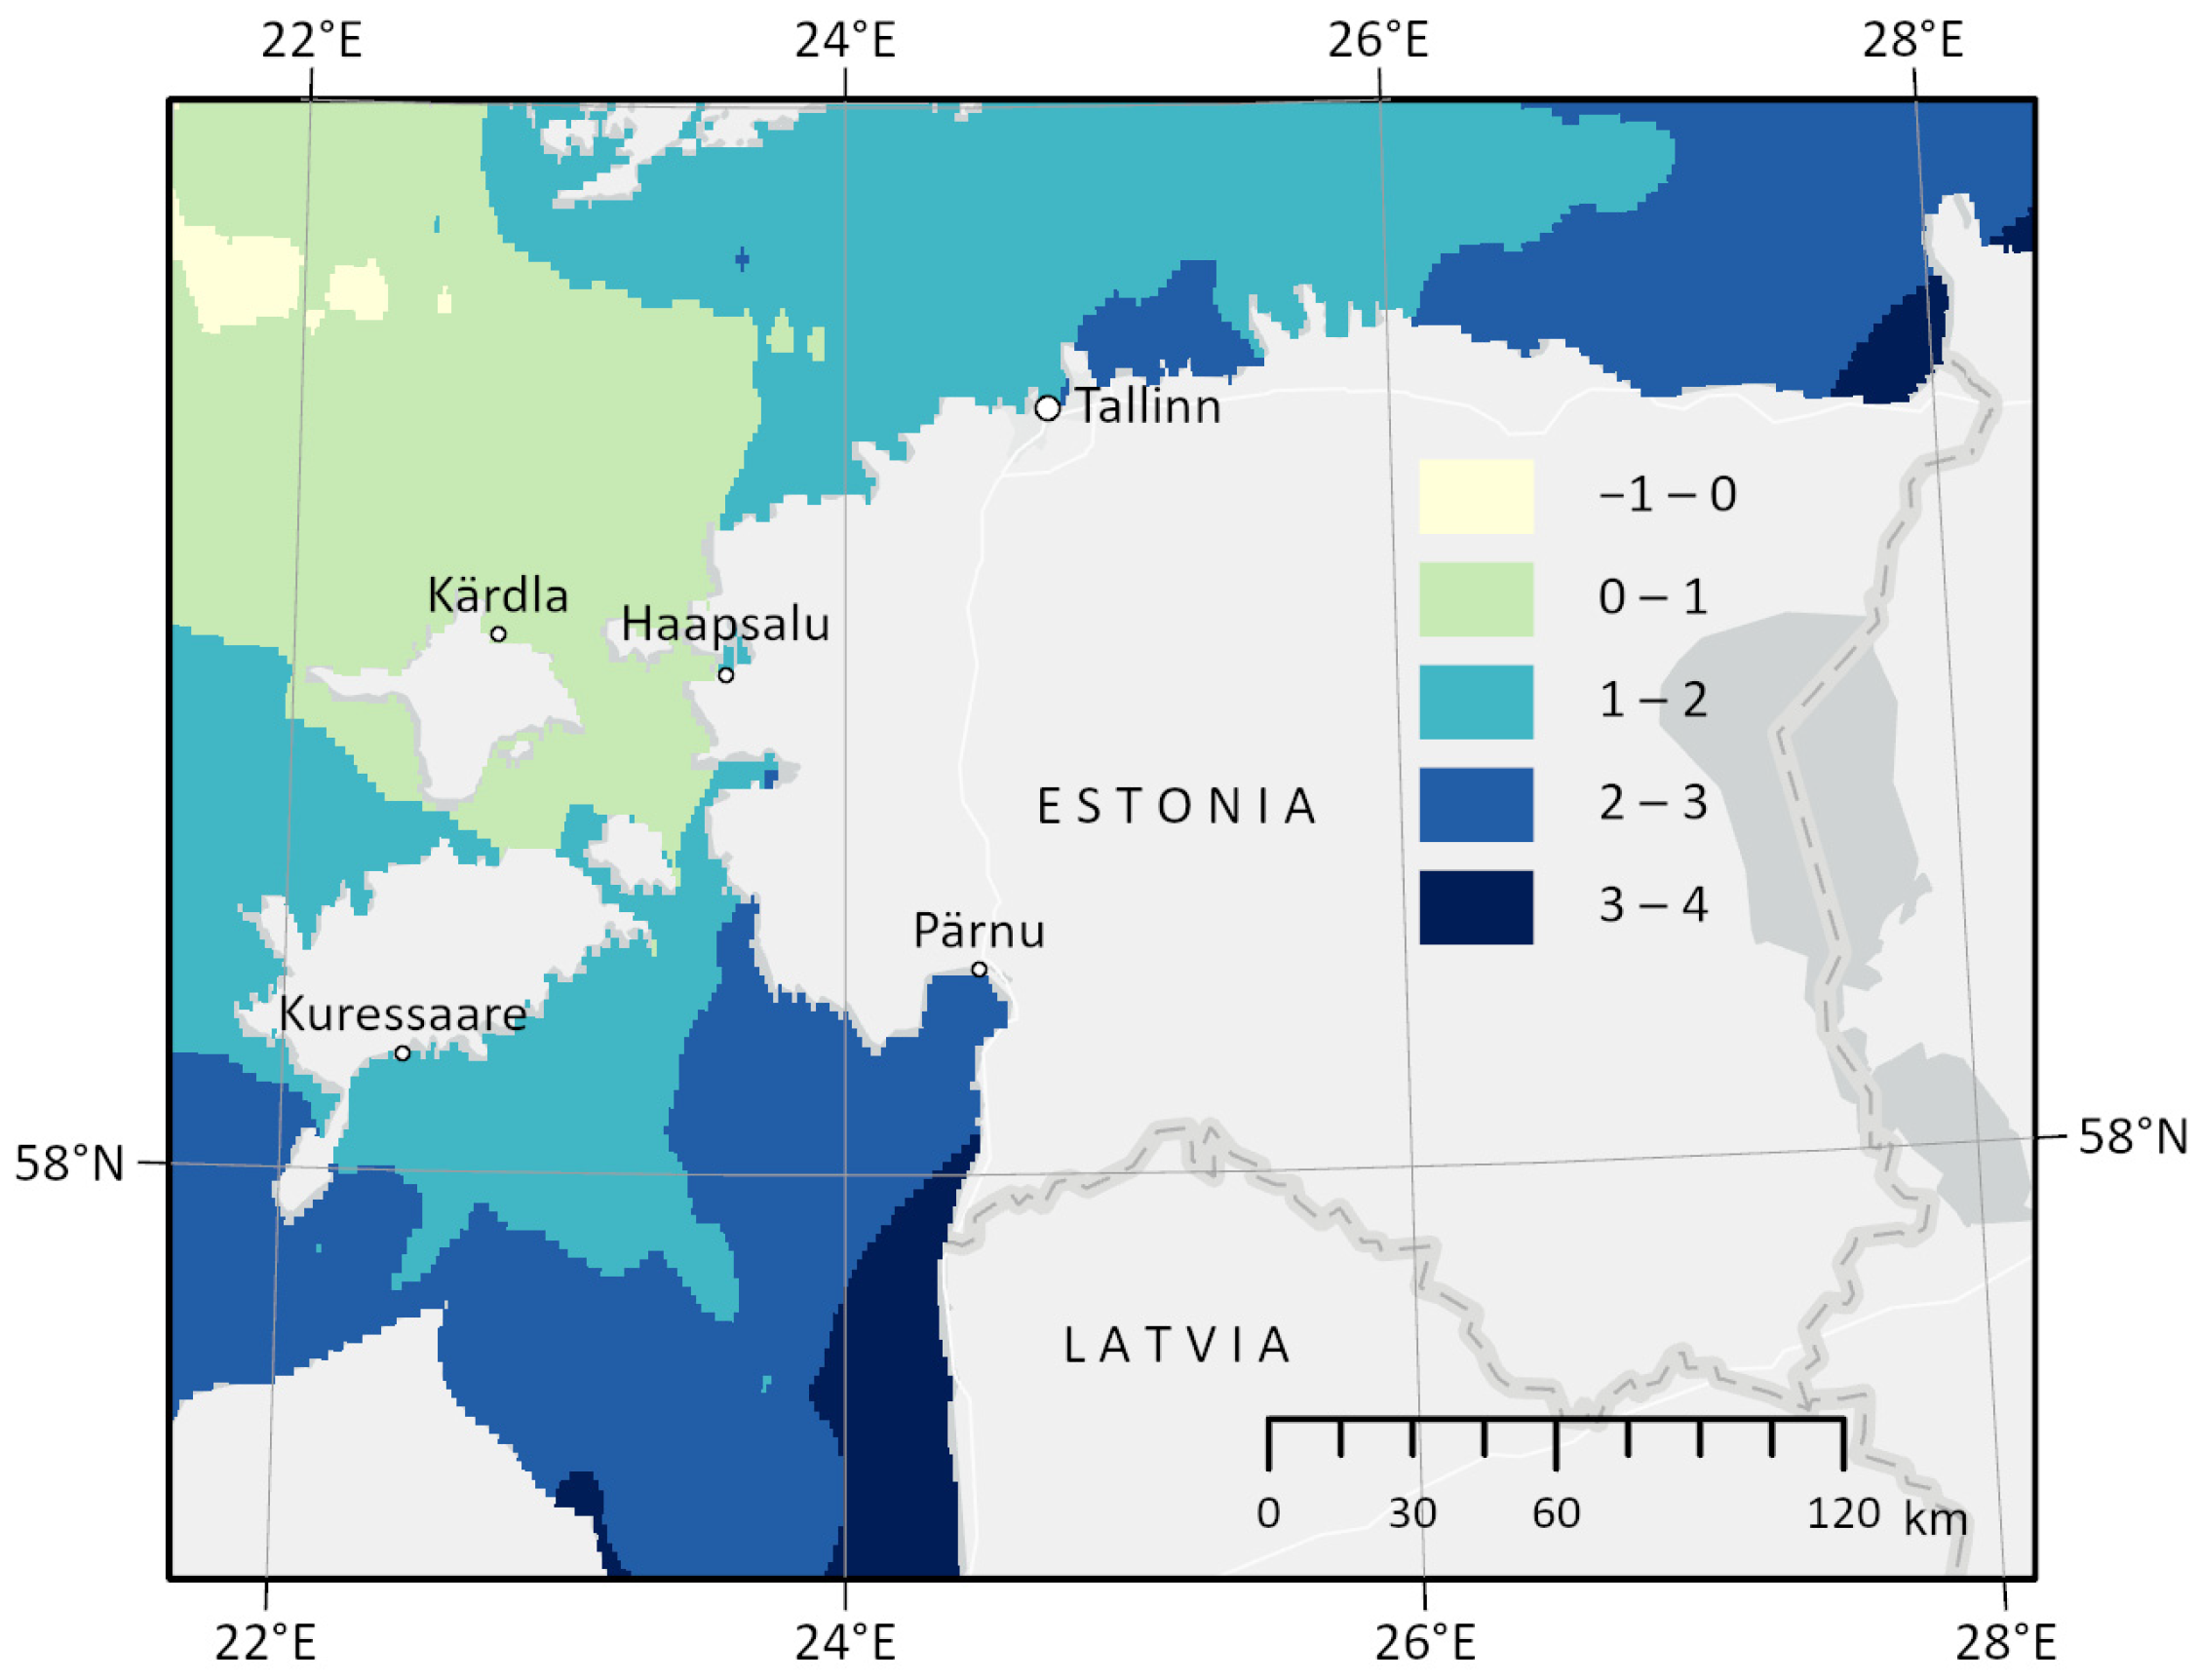
Using NKG2016LU and EST2020VEL absolute land uplift models, it was found that between 1993 and 2019, the relative sea level rise in the coastal area of Estonia is from −1.14 to 3.07 mm/yr based on the NKG2016LU model (Figure 8) and −0.29 to 3.41 mm/yr based on the EST2020VEL model (Figure 9).
It is noticeable that the relative sea level rise in the coastal area of Estonia is quite variable (Figure 8 and Figure 9). The most affected coastal area by relative sea level rise is the area on the west and southwest, where the coast is also quite flat. Other areas in Estonia are less vulnerable, where the coast is less flat and there are some glints.
The southwest and northeast of Estonia are affected by a relative sea level rise of 2 to 3 mm/yr. The fact that Estonia’s third largest city, Pärnu, is also located in the southwest is concerning because its shallow coastline has previously flooded [17]. In the northeast, relative sea level rise is not as vulnerable as in the southwest because the coastal area there is not flat and is lined with steep glints, as mentioned before.
In other coastal areas of Estonia, the relative sea level rise is lower. Relative sea level rise is lowest in the northeast, 0 to 1 mm/yr (cities of Kärdla, Haapsalu). In the west and north, the relative sea level rise is 1 to 2 mm/yr (cities of Kuressaare, Tallinn).
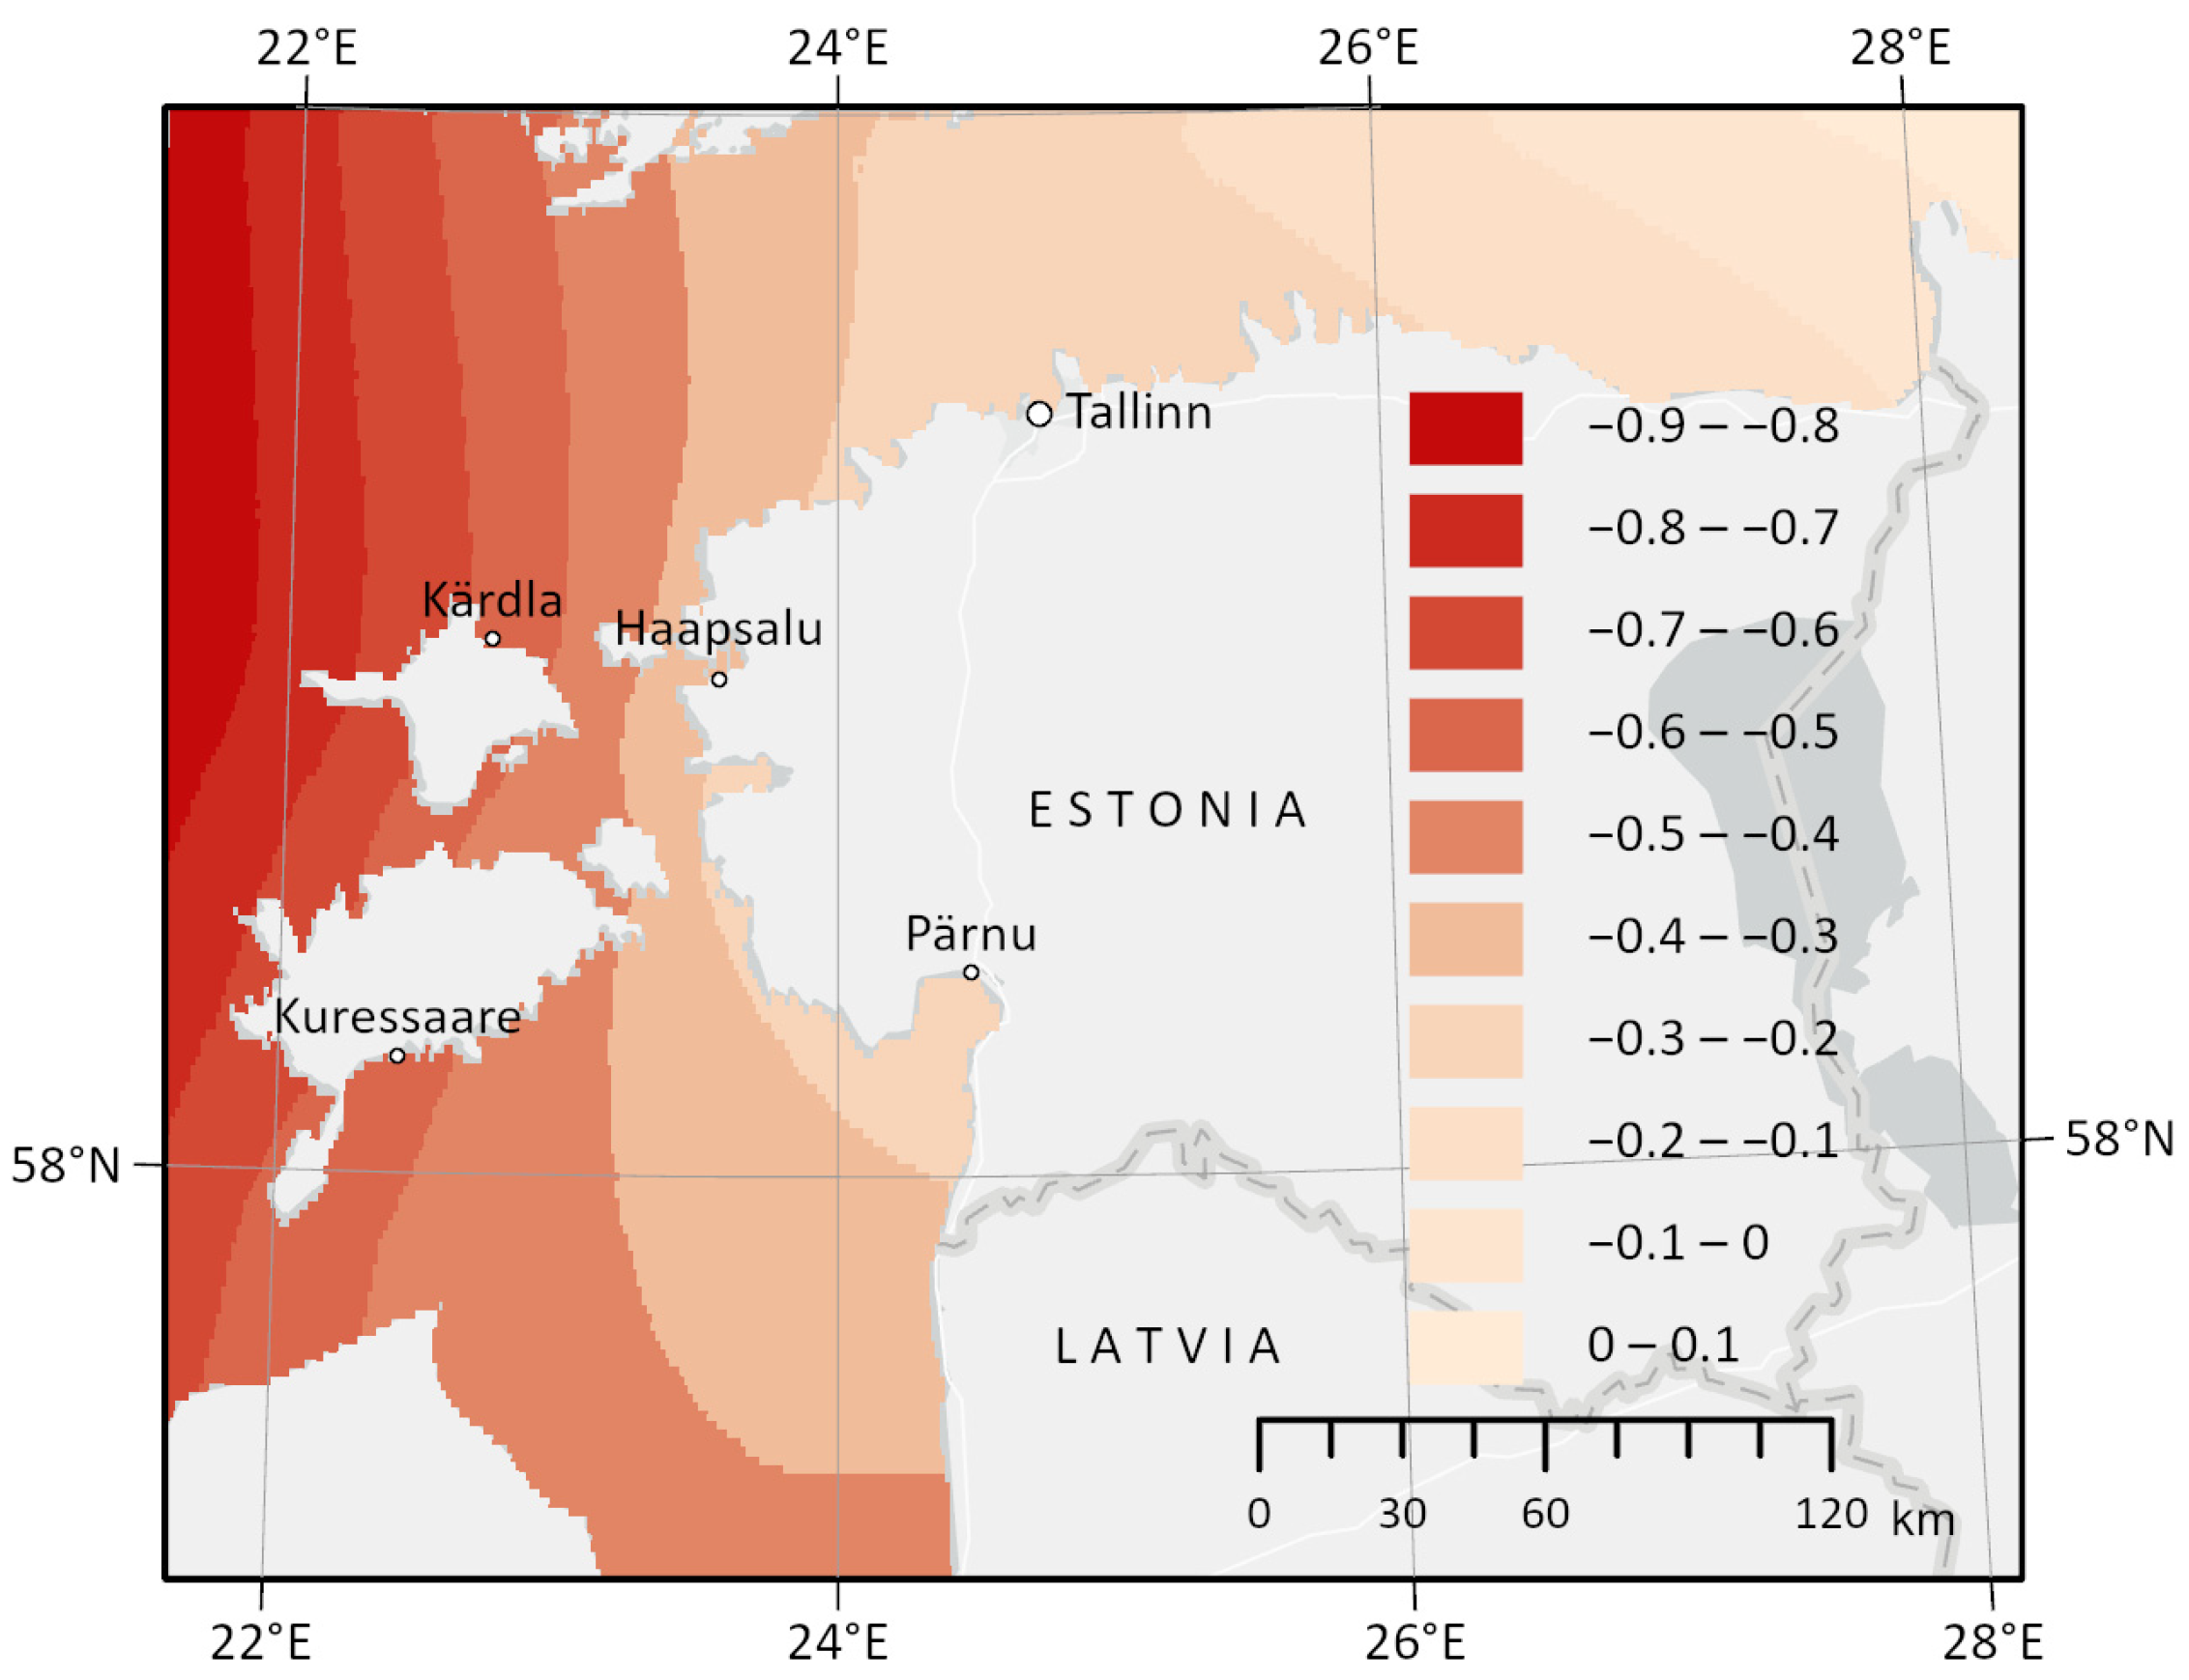
The study also found a difference in the relative sea level rise calculated based on two land uplift models and the ESA BalticSEAL model (Figure 10).
The difference in relative sea level rise between the two land uplift models is −0.9 to 0.1 mm/yr, and the mean difference is −0.42 mm/yr. The difference is higher on the coasts of the western islands. The difference in that area is higher due to the use of leveling data in calculating land uplift models. Note that leveling data has been used in the calculation of the NKG2016LU model but not for the EST2020VEL model. The difference is caused by the fact that the NKG2016LU model depends on the transfer of leveling data heights between the mainland and the islands, which can be considered one of the main causes of the difference in that area.
However, it can be concluded that both models are reliable for studying sea level rise because the difference between the models lies within the models’ uncertainties.
5. Sea Level Projections for the Year 2100
Sea level rise in the Baltic Sea has remained significant in recent centuries and especially in the last three decades. Based on tide gauges and satellite altimetry, sea level rise has been estimated to be increasing over time. However, to estimate future sea level rise, the United Nations Intergovernmental Panel on Climate Change (IPCC) relative sea level projection models by 2100 in their Fifth Assessment Report (AR5) was used in this study.
It is important to note that these projection models may not be very accurate predictions to achieve a completely accurate prediction for the future. The first reason is that the spatial resolution of the climate scenarios models is usually not very high. AR5 sea level models have a spatial resolution of 1° × 1° [18]. Consequently, it must be taken into account that the use of climate models in predicting sea level rise could be problematic in small water bodies, e.g., straits, islands, and bays, but even in the Baltic Sea because AR5 models do not consider the transport of water mass and heat from the North Atlantic. These models are only the result of the expansion of the water column in a relatively shallow sea [80].
To understand the sea level rise threats in the Baltic Sea region, these models are sufficiently accurate. However, the aforementioned must be considered, and AR5 model trends can be compared to the local models (see Section 5.1).
Table 3 shows the relative sea level rise projections in the Baltic Sea and the coastal area of Estonia by 2100 based on different IPCC AR5 climate scenarios (see Section 2, “Sea Level Trends in the Baltic Sea”).
Figure 11, Figure 12 and Figure 13 shows the relative sea level rise in the Baltic Sea by 2100 based on three different IPCC AR5 climate scenarios [18].
The three distinct sea level projections for the Baltic Sea indicate varying estimates of relative sea level rise by 2100. These projections highlight that the southern coastal regions face the highest risk. Across all scenarios, the projected relative sea level rise in these areas ranges from 0.3 to 0.7 m at most. Conversely, the northern areas are not significantly threatened by relative sea level rise, as the projections indicate a range of −0.6 to −0.3 m in those regions.
According to these projections, a relative sea level rise of 0.2 to 0.4 m is expected in the coastal area of Estonia by the year 2100 (Table 3). Additionally, there are some larger cities (Tallinn, Pärnu, Haapsalu, Kuressaare, Kärdla) situated in the coastal area where there are a lot of seaside real estate, businesses, and agricultural areas.
5.1. Sea Level Projections on the Coastal Area of Estonia
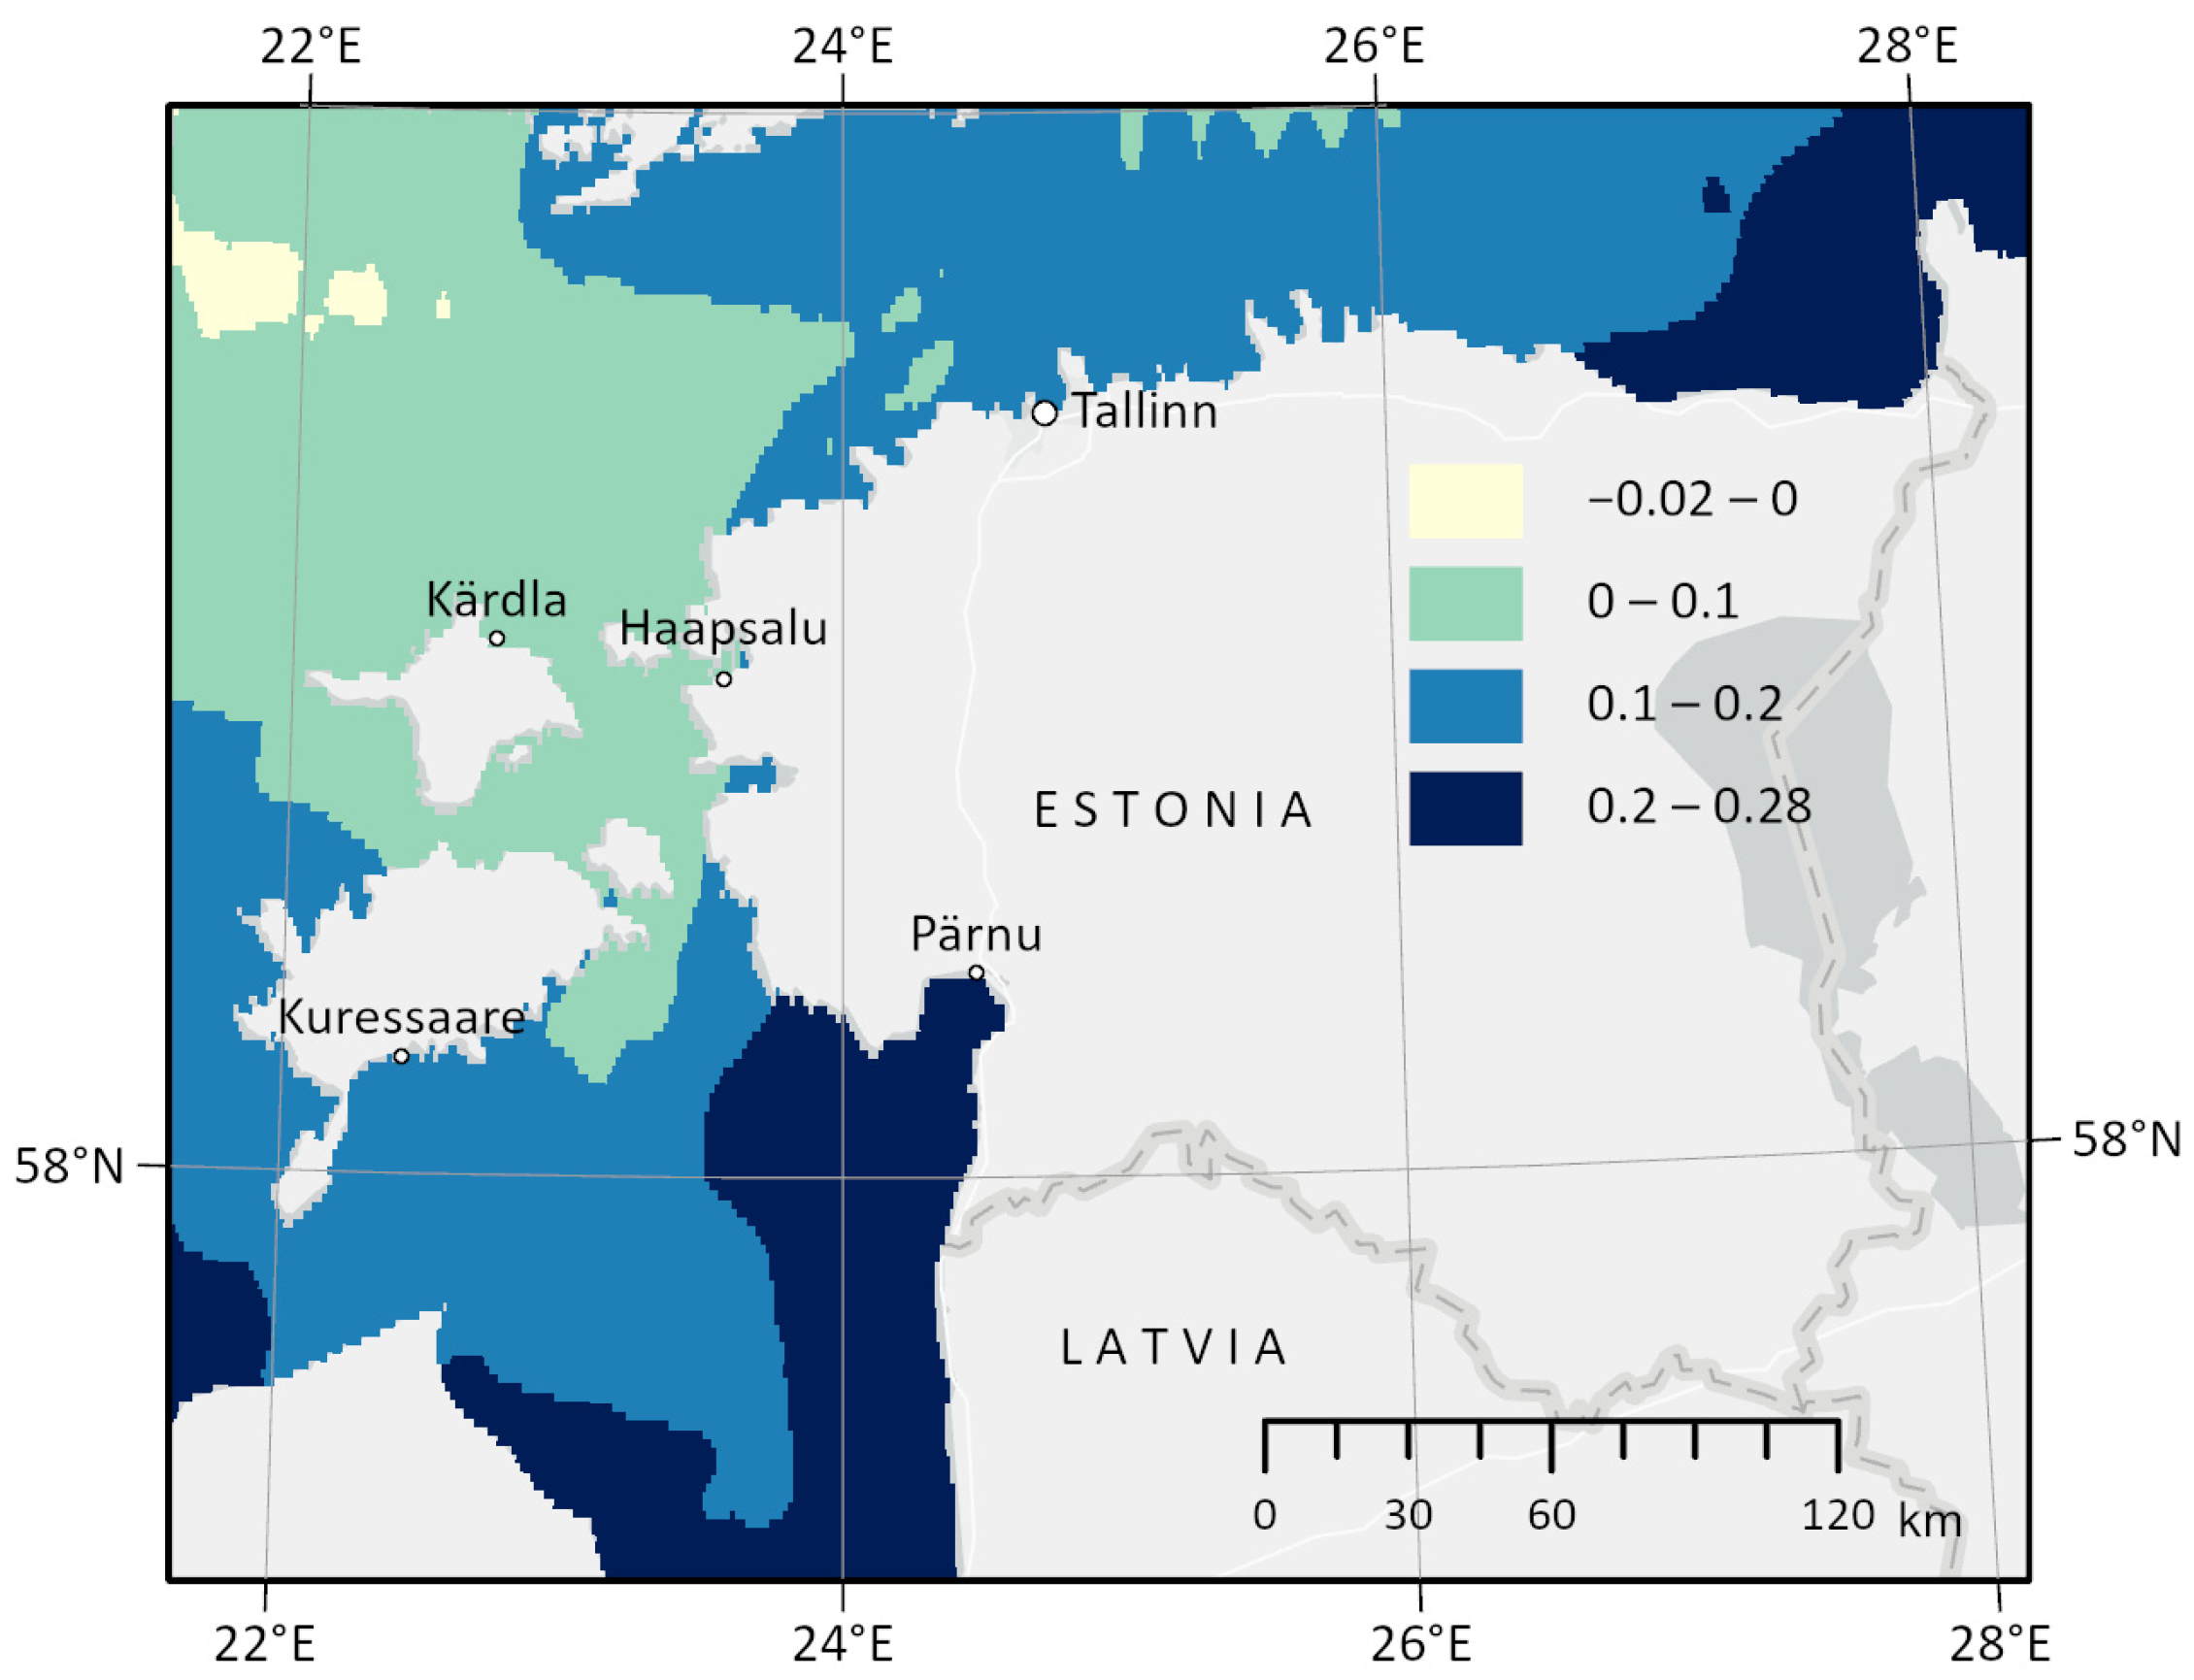
It can be observed that the coastal areas of Estonia are threatened by a significant relative sea level rise; therefore, in this study, the relative sea level rise by the year 2100 on the Estonian coast was studied in more detail. Using the ESA BalticSEAL model, this study found another relative sea level projection for the year 2100. It should be noted that the relative sea level rise based on the ESA’s model is calculated so that the relative sea level rise continues at a similar rate as it has between the years 1995–2019. For this, the relative sea level rise for 81 years was found based on the EST2020VEL land uplift model. Figure 14 shows the relative sea level rise by 2100 based on the ESA BalticSEAL model.
It is notable that the relative sea level rise by the year 2100 based on the ESA model is similar to the IPCC AR5 models, 0 to 0.3 m by 2100. Based on both models, Estonian coastal areas are particularly vulnerable to relative sea level rise.
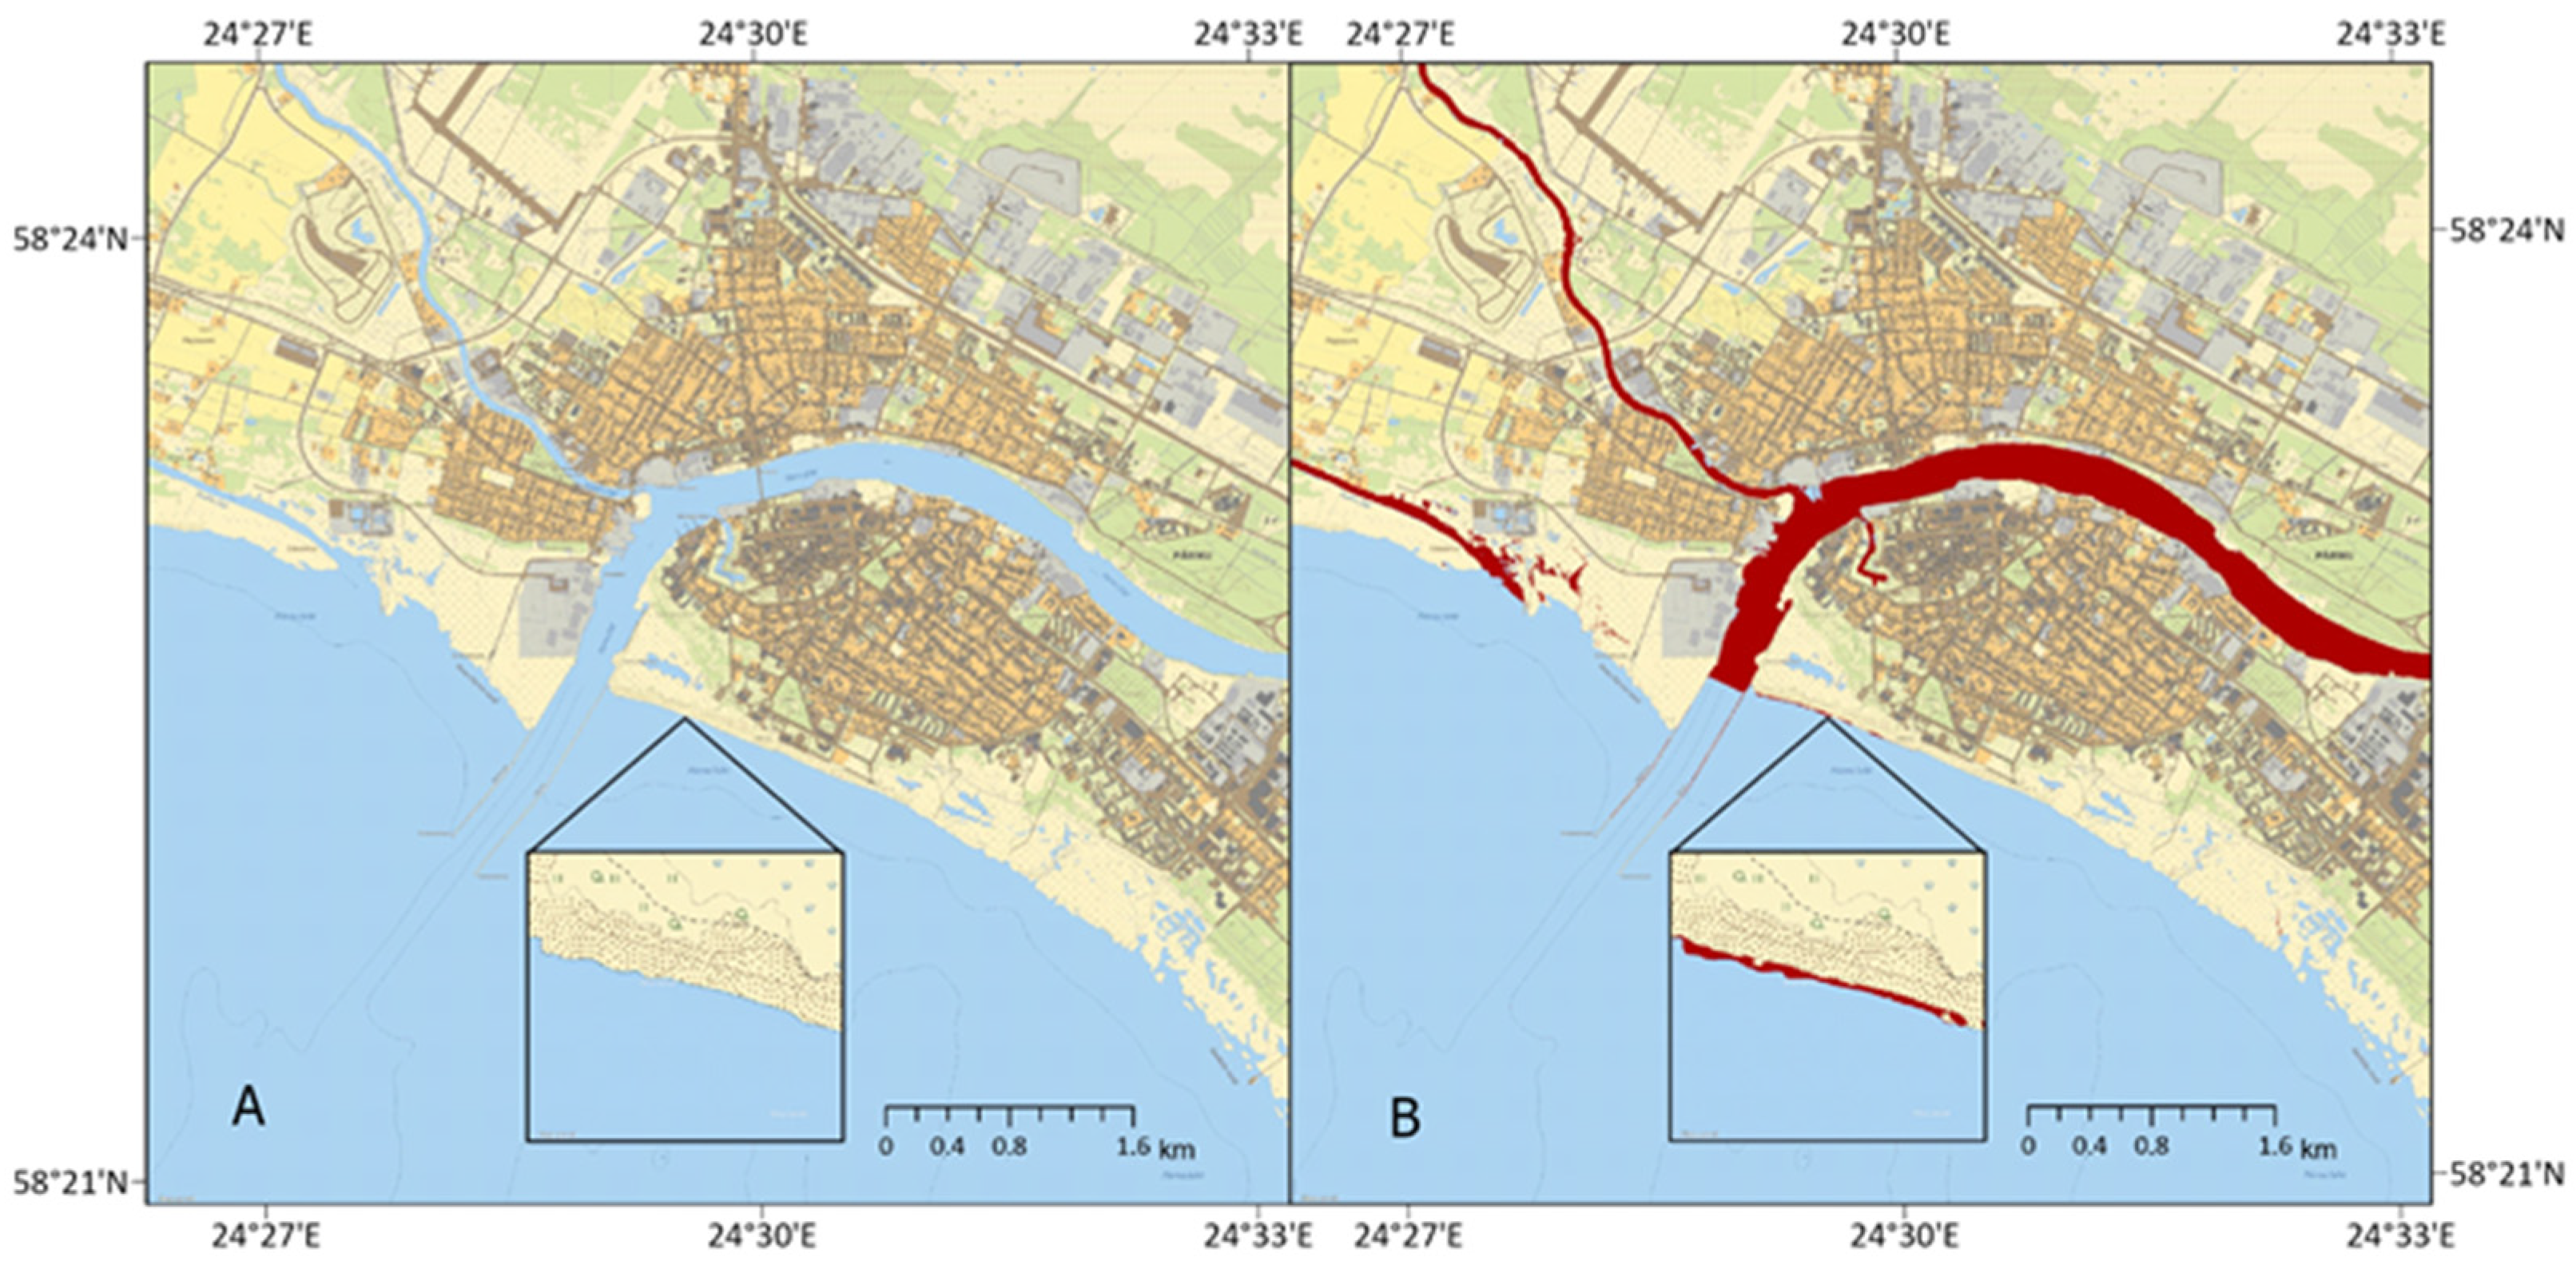
To more accurately represent the effect of the relative sea level rise on the city of Pärnu, which is expected to have the highest sea level rise among Estonian cities, the relative sea level rise based on the ESA and EST2020VEL model was projected by using the Estonian digital terrain model with a resolution of 1 m. Figure 15A shows Pärnu on the Estonian basic map, and Figure 15B indicates in red the threatened areas if the relative sea level in Pärnu rises by 0.28 m by the year 2100 (Figure 14).
It is evident that the relative sea level rise in Pärnu will primarily affect the coastline of the sea and banks of the rivers Pärnu and Sauga, where the ground is decreasing relative to sea level. What is not considered in Figure 13 is local land subsidence in Pärnu, detected in many studies [81,82,83,84], which could lead to an even larger impact of sea level rise.
Hence, the consequences of sea level rise in the Baltic Sea for the Pärnu can be significant. High sea levels can lead to increased erosion and flooding along the coastline, as well as damage to infrastructure and property, especially considering that the relative sea level is rising and Pärnu has historically also faced severe floods. One of the largest floods in recent history was the storm of January 2005, when the highest storm surge on record in Pärnu was +275 cm over mean sea level [17], which caused significant flooding in Pärnu.
6. Conclusions
Sea level rise is one of the most critical environmental challenges of our time, with potentially devastating consequences for coastal communities worldwide. The Baltic Sea, located in Northern Europe, is no exception to this threat.
This area is currently experiencing a fast rate of sea level rise. According to various studies, it has been found that in the 20th century, the level of the Baltic Sea rose by 1.3 to 1.6 mm/yr based on the tide gauges, but the beginning of the 21st century has not brought about a change in the sea level rise. The sea level rise has also accelerated further, approximately twice. Based on studies using satellite altimetry, the sea level rise of the Baltic Sea between 1991 and 2020 has been estimated at 3.3 to 4.1 mm/yr level. In studies based on tide gauges, it has been determined that the sea level rise of the Baltic Sea during the same period is approximately 3 mm/yr. According to IPCC AR5 climate scenario models, the relative sea level of the Baltic Sea will rise by 0.3–0.7 m in the southern part by 2100. In the northern part, the relative sea level falls between −0.6 to −0.3 m instead. However, using either tide gauge or satellite altimetry methods, it can be observed that the values of the sea level rise of the Baltic Sea are similar, showing an accelerating sea level rise but the sea level rises found by different methods are not comparable. This is because different studies find either absolute or relative sea level rise. The absolute level is predominantly found using satellite altimetry data, and the relative sea level rise is found using data from tide gauges. Different values are not directly comparable because different reference surfaces, time periods, etc., are used. For absolute and relative sea levels to be comparable, conversions should be made to find a comparable sea level rise.
This paper also analyzed relative sea level rise in the Baltic Sea using the ESA BalticSEAL absolute sea level rise model, land uplift models NKG2016LU and EST2020VEL, and IPCC AR5 sea level projections by 2100. It was found that relative sea level rise would threaten the southern area of the Baltic Sea at first. In that area, the relative sea level rises in coastal areas from 0 to 3 mm/yr in Estonia, Latvia, and Lithuania, 1 to 3 mm/yr in Denmark and Germany, and 3 to 4.5 mm/yr in Poland and Russia. In Sweden and Finland, relative sea level rise is most variable in the south-north direction. There is a relative sea level rise of −5 to 4 mm/yr and −5 to 2 mm/yr, respectively. The northern area is not threatened by sea level rise.
In the coastal area of Estonia, it was found that the relative sea level rises in the coastal area of Estonia from 1.1 to 3.1 mm/yr based on the NKG2016LU model (Figure 8) and −0.3 to 3.4 mm/yr based on the EST2020VEL model (Figure 9). It becomes apparent that western Estonia, and especially the southwestern part, is most threatened by sea level rise. The relative sea level projection in Estonia based on the ESA BalticSEAL and EST2020VEL models by the year 2100 was also analyzed. It was found that the relative sea level rise by the year 2100 will be from 0 to 0.28 m in the coastal areas of Estonia. According to IPCC AR5 climate scenario models, the relative sea level in the Estonian coastal areas will rise by 0.2–0.4 m, similar to the sea level rise based on the ESA BalticSEAL and EST2020VEL.
Since the sea level rise is the highest on the southwestern coast of Estonia, the relative sea level rise was depicted in the city of Pärnu, where floods have also occurred in the past. For this purpose, a digital terrain model was used, and the sea level rise was depicted on the map. It turned out that the shallower coastal area of the sea and the rivers there are most threatened by sea level rise, which will remain partially under water by the year 2100.
Finally, it is important to continue study in this area to determine how the sea level of the Baltic Sea is changing and what the impact of sea level rise on coastal areas is and will be. Going forward, it is important to learn how specific areas are affected by sea level rise.
Author Contributions
Conceptualization, I.K., T.K. and A.L.; methodology, I.K.; software, I.K.; investigation, I.K.; resources, I.K., T.K. and A.L.; data curation, I.K.; writing—original draft preparation, I.K.; writing—review and editing, I.K., T.K. and A.L.; visualization, I.K.; supervision, T.K. and A.L.; project administration, T.K. and A.L.; funding acquisition, T.K. and A.L. All authors have read and agreed to the published version of the manuscript.
Funding
This research was supported by the Estonian University of Life Sciences baseline funding grants Towards the Multidimensional Deformation Model by Combining Satellite Geodetic and In-Situ Measurements for the Implementation of a Dynamic Reference Frame in Estonia, grant number P220167MIMP; and A 3D model of intraplate deformations combining remote sensing and in-situ measurements with an application to implement a semi-dynamic reference frame in Estonia, grant number P200188MIGX.
Institutional Review Board Statement
Not applicable.
Informed Consent Statement
Not applicable.
Data Availability Statement
The used models’ data can be obtained from the webpages of Baltic Sea Multi-mission Sea Level Products (ESA BalticSEAL): https://balticseal.eu/data-access/ (accessed on 10 July 2022) and BRGM: Regional sea level change (IPCC AR5): https://sealevelrise.brgm.fr/sea-level-scenarios (accessed on 24 July 2022). The employed NKG2016LU VLM model is provided by the Lantmäteriet (on behalf of the Nordic Geodetic Commission—NKG): https://www.lantmateriet.se (accessed on 28 February 2021). EST2020VEL model is available from Tarmo Kall upon reasonable request.
Acknowledgments
We would like to thank the four anonymous reviewers for their constructive comments on the manuscript that were provided, together with useful suggestions.
Conflicts of Interest
The authors declare no conflict of interest.
References
- Parker, B.B. Sea level as an indicator of climate and global change. Mar. Technol. Soc. J. 1992, 25. [Google Scholar]
- Nicholls, R.J.; Wong, P.P.; Burkett, V.R.; Codignotto, J.O.; Hay, J.E.; Mclean, R.F.; Ragoonaden, S.; Woodroffe, C.D. Coastal Systems and Low-Lying Areas. In Climate Change 2007: Impacts, Adaptation and Vulnerability; Parry, M.L., Canziani, O.F., Palutikof, J.P., Van Der Linden, P.J., Hanson, C.E., Eds.; Contribution of Working Group II to the Fourth Assessment Report of the Intergovernmental Panel on Climate Change; Cambridge University Press: Cambridge, UK, 2007; pp. 315–356. [Google Scholar]
- Gopalakrishnan, T.; Hasan, M.K.; Haque, A.T.M.S.; Jayasinghe, S.L.; Kumar, L. Sustainability of Coastal Agriculture under Climate Change. Sustainability 2019, 11, 7200. [Google Scholar] [CrossRef] [Green Version]
- Gornall, J.; Betts, R.; Burke, E.; Clark, R.; Camp, J.; Willett, K.; Wiltshire, A. Implications of climate change for agricultural productivity in the early twenty-first century. Philos. Trans. R. Soc. London Ser. B Biol. Sci. 2010, 365, 2973–2989. [Google Scholar] [CrossRef] [PubMed]
- Bin, O.; Poulter, B.; Dumas, C.F.; Whitehead, J.C. Measuring the Impact of Sea-Level Rise on Coastal Real Estate: A Hedonic Property Model Approach. J. Reg. Sci. 2011, 51, 751–767. [Google Scholar] [CrossRef] [Green Version]
- BACC I Author Team. Assessment of Climate Change for the Baltic Sea Basin, 1st ed.; Springer: Berlin/Heidelberg, Germany, 2008. [Google Scholar]
- BACC II Author Team. Second Assessment of Climate Change for the Baltic Sea Basin, 2nd ed.; Springer: Berlin/Heidelberg, Germany, 2015. [Google Scholar]
- Meier, H.E.M.; Broman, B.; Kjellstrom, E. Simulated sea level in past and future climates of the Baltic Sea. Clim. Res. 2004, 27, 59–75. [Google Scholar] [CrossRef]
- Kont, A.; Jaagus, J.; Aunap, R. Climate change scenarios and the effect of sea-level rise for Estonia. Glob. Planet. Chang. 2003, 36, 1–15. [Google Scholar] [CrossRef]
- Meier, H.E.M.; Broman, B.; Kallio, H.; Kjellström, E. Projections of future surface winds sea levels and wind waves in the late 21st century and their application for impact studies of flood prone areas in the Baltic Sea region. In Special Paper of Geological Survey of Finland; Schmidt-Tome, P., Ed.; Geological Survey of Finland: Helsinki, Finland, 2006; pp. 23–43. [Google Scholar]
- Orviku, K.; Jaagus, J.; Kont, A.; Ratas, U.; Rivis, R. Increasing activity of coastal processes associated with climate change in Estonia. J. Coast. Res. 2003, 19, 364–375. [Google Scholar]
- Hünicke, B.; Zorita, E.; Soomere, T.; Madsen, K.S.; Johansson, M.; Suursaar, Ü. Recent Change—Sea Level and Wind Waves. In Second Assessment of Climate Change for the Baltic Sea Basin; Regional Climate Studies; The BACC II Author Team, Ed.; Springer: Cham, Switzerland, 2015; pp. 155–180. [Google Scholar] [CrossRef] [Green Version]
- Suursaar, Ü.; Kullas, T. Influence of wind climate changes on the mean sea level and current regime in the coastal waters of west Estonia, Baltic Sea. Oceanologia 2006, 48, 361–383. [Google Scholar]
- Jaagus, J.; Suursaar, Ü. Long-term storminess and sea level variations on the Estonian coast of the Baltic Sea in relation to large-scale atmospheric circulation. Est. J. Earth Sci. 2013, 62, 73–92. [Google Scholar] [CrossRef]
- Bonaduce, A.; Staneva, J.; Behrens, A.; Bidlot, J.-R.; Wilcke, R.A.I. Wave Climate Change in the North Sea and Baltic Sea. J. Mar. Sci. Eng. 2019, 7, 166. [Google Scholar] [CrossRef] [Green Version]
- Myslenkov, S.A.; Medvedeva, A.Y.; Arkhipkin, V.; Markina, M.; Surkova, G.; Krylov, A.; Dobrolyubov, S.; Zilitinkevich, S.; Koltermann, K. Long-term statistics of storms in the Baltic, Barents and White Seas and their future climate projections. Geogr. Environ. Sustain. 2018, 11, 93–112. [Google Scholar] [CrossRef] [Green Version]
- Suursaar, U.; Kullas, T.; Otsmann, M.; Saaremae, I.; Kuik, J.; Merilain, M. Cyclone Gudrun in January 2005 and modelling its hydrodynamic consequences in the Estonian coastal waters. Boreal Environ. Res. 2006, 11, 143–159. [Google Scholar]
- BRGM: Regional Sea Level Change (IPCC AR5). Available online: https://sealevelrise.brgm.fr/sea-level-scenarios/#map=0/2/0.000000/0.000000/ar5scenario_allmodels_RCP85/2027/greendyn_m,greensmb_m,antdyn_m,antsmb_m,glac_m,gia_m,ocn_m,grw_m&map=1/2/0.000000/0.000000/greendyn_m,greensmb_m,antdyn_m,antsmb_m,glac_m,ocn_m,grw_m,gia_m/5,10,16,-5,18,32,5,1&map=2/4/-5.595840/46.046576/low/low-end-SLR-projections-RCP26/proj_median&map=3/1.4429434958487284/0.000000/0.000000/srocc-slr-85/2022/slr_md&tab=ar5 (accessed on 24 July 2022).
- Church, J.A.; Clark, P.U.; Cazenave, A.; Gregory, J.M.; Jevrejeva, S.; Levermann, A.; Merrifield, M.A.; Milne, G.A.; Nerem, R.S.; Nunn, P.D.; et al. Sea Level Change. In Climate Change 2013: The Physical Science Basis. Contribution of Working Group I to the Fifth Assessment Report of the Intergovernmental Panel on Climate Change; Stocker, T.F., Qin, D., Plattner, G.-K., Tignor, M., Allen, S.K., Boschung, J., Nauels, A., Xia, Y., Bex, V., Midgley, P.M., Eds.; Cambridge University Press: Cambridge, UK; New York, NY, USA, 2013; pp. 1137–1216. [Google Scholar]
- Climate Change Indicators: Sea Level. Available online: https://www.epa.gov/climate-indicators/climate-change-indicators-sea-level (accessed on 26 January 2023).
- Ekman, M. The Changing Level of the Baltic Sea During 300 Years: A Clue to Understanding the Earth; Summer Institute for Historical Geophysics: Åland Islands, Finland, 2009. [Google Scholar]
- Ekman, M. Post-glacial rebound and sea level phenomena with special reference to Fennoscandia and the Baltic Sea. Geod. Geophys. 1993, 115, 7–70. [Google Scholar]
- Lambeck, K.; Smither, C.; Johnston, P. Sea-level change, glacial rebound and mantle viscosity for Northern Europe. Geophys. J. Int. 1998, 134, 102–144. [Google Scholar] [CrossRef] [Green Version]
- Milne, G.A.; Davis, J.L.; Mitrovica, J.X.; Scherneck, H.G.; Johansson, J.M.; Vermeer, M.; Koivula, H. Space-geodetic constraints on glacial isostatic adjustment in Fennoscandia. Science 2001, 291, 2381–2385. [Google Scholar] [CrossRef] [Green Version]
- Steffen, H.; Kaufmann, G.; Wu, P. Three-dimensional finite-element modeling of the glacial isostatic adjustment in Fennoscandia. Earth Planet. Sci. Lett. 2006, 250, 358–375. [Google Scholar] [CrossRef]
- Zhao, S.; Lambeck, K.; Lidberg, M. Lithosphere thickness and mantle viscosity inverted from GPS-derived deformation rates in Fennoscandia. Geophys. J. Int. 2012, 190, 278–292. [Google Scholar] [CrossRef]
- Van der Wal, W.; Barnhoorn, A.; Stocchi, P.; Gradmann, S.; Wu, P.; Drury, M.R.; Vermeersen, B. Glacial isostatic adjustment model with composite 3-D Earth arheology for Fennoscandia. Geophys. J. Int. 2013, 194, 61–77. [Google Scholar] [CrossRef]
- Vestøl, O.; Ågren, J.; Steffen, H.; Kierulf, H.; Tarasov, L. NKG2016LU: A new land uplift model for Fennoscandia and the Baltic Region. J. Geod. 2019, 93, 1759–1779. [Google Scholar] [CrossRef] [Green Version]
- Pattyn, F.; Ritz, C.; Hanna, E.; Asay-Davis, X.; DeConto, R.; Durand, G.; Favier, L.; Fettweis, X.; Goelzer, H.; Golledge, N.R. The Greenland and Antarctic ice sheets under 1.5 °C global warming. Nat. Clim. Chang. 2018, 8, 1053–1061. [Google Scholar] [CrossRef] [Green Version]
- Wigley, T.; Raper, S. Thermal expansion of sea water associated with global warming. Nature 1987, 330, 127–131. [Google Scholar] [CrossRef] [Green Version]
- Oppenheimer, M.; Glavovic, B.C.; Hinkel, J.; van de Wal, R.; Magnan, A.K.; Abd-Elgawad, A.; Cai, R.; Cifuentes-Jara, M.; DeConto, R.M.; Ghosh, T.; et al. Sea Level Rise and Implications for Low-Lying Islands, Coasts and Communities. In IPCC Special Report on the Ocean and Cryosphere in a Changing Climate; Pörtner, H.-O., Roberts, D., Masson, C., Delmotte, V., Zhai, P., Tignor, M., Poloczanska, E., Mintenbeck, K., Alegría, A., Nicolai, M., et al., Eds.; Cambridge University Press: Cambridge, UK; New York, NY, USA, 2019; pp. 321–445. [Google Scholar] [CrossRef]
- Ablain, M.; Cazenave, A.; Larnicol, G.; Balmaseda, M.; Cipollini, P.; Faugère, Y.; Fernandes, M.J.; Henry, O.; Johannessen, J.A.; Knudsen, P.; et al. Improved sea level record over the satellite altimetry era (1993–2010) from the Climate Change Initiative project. Ocean Sci. 2015, 11, 67–82. [Google Scholar] [CrossRef] [Green Version]
- Cazenave, A.; Dieng, H.-B.; Meyssignac, B.; Schuckmann, K.; Decharme, B.; Berthier, E. The rate of sea-level rise. Nat. Clim. Chang. 2014, 4, 358–361. [Google Scholar] [CrossRef]
- Nerem, R.S.; Beckley, B.D.; Fasullo, J.T.; Hamlington, B.D.; Masters, D.; Mitchum, G.T. Climate-change-driven accelerated sea-level rise detected in the altimeter era. Proc. Natl. Acad. Sci. USA 2018, 115, 2022–2025. [Google Scholar] [CrossRef] [PubMed] [Green Version]
- World Meteorological Organization. State of the Global Climate 2022; WMO: Geneva, Switzerland, 2023. [Google Scholar]
- Ekman, M. The worlds longest continued series of sea level observations. Pure Appl. Geophys. 1988, 127, 73–77. [Google Scholar] [CrossRef]
- Bogdanov, V.I.; Medvedev, M.Y.; Solodov, V.A.; Trapeznikov, Y.A.; Troshkov, G.A.; Trubitsina, A.A. Mean monthly series of sea level observations (1777–1993) at the Kronstadt gauge. In Reports of the Finnish Geodetic Institute; Finnish Geospatial Research Institute: Kirkkonummi, Finland, 2000; pp. 1–34. [Google Scholar]
- Pugh, D. Tides, Surges and Mean Sea Level: A Handbook for Engineers and Scientists; John Wiley & Sons: Chichester, UK, 1987; 472p. [Google Scholar]
- Boiten, W. Hydrometry: IHE Delft Lecture Note Series, 3rd ed.; CRC Press: Boca Raton, FL, USA, 2008. [Google Scholar] [CrossRef]
- Intergovernmental Oceanographic Commission. Manual on Sea Level Measurement and Interpretation; Volume IV—An Update to 2006; UNESCO: Paris, France, 2006; 87p. [Google Scholar] [CrossRef]
- Copernicus Marine Environment Monitoring Service In Situ Thematic Assembly Centre. Available online: http://www.marineinsitu.eu/dashboard/ (accessed on 15 January 2023).
- Permanent Service for Mean Sea Level (PSMSL). Available online: https://www.psmsl.org/ (accessed on 20 January 2023).
- Madsen, K.S.; Hoyer, J.L.; Suursaar, U.; She, J.; Knudsen, P. Sea Level Trends and Variability of the Baltic Sea from 2D Statistical Reconstruction and Altimetry. Front. Earth Sci. 2019, 7, 243. [Google Scholar] [CrossRef]
- Global Extreme Sea Level Analysis Initiative (GESLA). Available online: https://www.gesla.org/ (accessed on 20 January 2023).
- The Flanders Marine Institute (VIZ). Available online: https://www.vliz.be/en (accessed on 20 January 2023).
- The University of Hawaii-Sea-Level Central (UHSLC). Available online: https://uhslc.soest.hawaii.edu/ (accessed on 20 January 2023).
- Nerem, S.R.; Chambers, P.D.; Choe, C.; Mitchum, T.G. Estimating Mean Sea Level Change from the TOPEX and Jason Altimeter Missions. Mar. Geod. 2010, 33, 435–446. [Google Scholar] [CrossRef]
- Fu, L.L.; Cazenave, A. Satellite Altimetry and Earth Sciences: A Handbook of Techniques and Applications; Elsevier International Geophysics Series; Elsevier: Amsterdam, The Netherlands, 2001; pp. 1–463. [Google Scholar]
- Legeais, J.-F.; Ablain, M.; Zawadzki, L.; Zuo, H.; Johannessen, J.A.; Scharffenberg, M.G.; Fenoglio-Marc, L.; Fernandes, M.J.; Andersen, O.B.; Rudenko, S.; et al. An improved and homogeneous altimeter sea level record from the ESA Climate Change Initiative. Earth Syst. Sci. Data 2018, 10, 281–301. [Google Scholar] [CrossRef] [Green Version]
- Liibusk, A.; Kall, T.; Rikka, S.; Uiboupin, R.; Suursaar, Ü.; Tseng, K.-H. Validation of Copernicus Sea Level Altimetry Products in the Baltic Sea and Estonian Lakes. Remote Sens. 2020, 12, 4062. [Google Scholar] [CrossRef]
- Liebsch, G.; Novotny, K.; Dietrich, R.; Shum, C.K. Comparison of Multimission Altimetric Sea-Surface Heights with Tide Gauge Observations in the Southern Baltic Sea. Mar. Geod. 2002, 25, 213–234. [Google Scholar] [CrossRef]
- Richter, A.; Groh, A.; Dietrich, R. Geodetic observation of sea-level change and crustal deformation in the Baltic Sea region. Phys. Chem. Earth 2012, 53, 43–53. [Google Scholar] [CrossRef]
- Ekman, M. Climate changes d etected through the world’s longest sea level series. Glob. Planet. Chang. 1999, 21, 215–224. [Google Scholar] [CrossRef]
- Suursaar, Ü.; Sooäär, J. Decadal variations in mean and extreme sea level values along the Estonian coast of the Baltic Sea. Tellus A Dyn. Meteorol. Oceanogr. 2007, 59, 249–260. [Google Scholar] [CrossRef]
- Nordman, M.; Poutanen, M.; Koivula, H. Tide gauge monitoring using GPS. In Dynamic Planet; Springer: Berlin/Heidelberg, Germany, 2007; pp. 75–79. [Google Scholar] [CrossRef]
- Dailidiene, I.; Davuliene, L.; Tilickis, B.; Stankevičius, A.; Myrberg, K. Sea level variability at the Lithuanian coast of the Baltic Sea. Boreal Environ. Res. 2006, 11, 109–121. [Google Scholar]
- Lyszkowicz, A.; Bernatowicz, A. Geocentric Changes of the Mean Sea Level of the Baltic Sea from Altimeter and Tide Gauge Data. In Proceedings of the 2018 Baltic Geodetic Congress (BGC Geomatics), Olsztyn, Poland, 21–23 June 2018; pp. 202–206. [Google Scholar] [CrossRef]
- Vallner, L.; Sildvee, H.; Torim, A. Recent crustal movements in Estonia. J. Geodyn. 1988, 9, 215–223. [Google Scholar] [CrossRef]
- Church, J.A.; White, N.J. A 20th century acceleration in global sea-level rise. Geophys. Res. Lett. 2006, 33, L10602. [Google Scholar] [CrossRef]
- Stramska, M.; Chudziak, N. Recent multiyear trends in the Baltic Sea level. Oceanologia 2013, 55, 319–337. [Google Scholar] [CrossRef] [Green Version]
- Pajak, K.; Błaszczak-Bąk, W. Baltic Sea level changes from satellite altimetry data based on the OptD metod. Acta Geodyn. Geomater. 2019, 16, 235–244. [Google Scholar] [CrossRef]
- Passaro, M.; Müller, F.L.; Oelsmann, J.; Rautiainen, L.; Dettmering, D.; Hart-Davis, M.G.; Abulaitijiang, A.; Andersen, O.B.; Høyer, J.L.; Madsen, K.S.; et al. Absolute Baltic Sea Level Trends in the Satellite Altimetry Era: A Revisit. Front. Mar. Sci. 2021, 8, 647607. [Google Scholar] [CrossRef]
- Novotny, K.; Liebsch, G.; Lehmann, A.; Dietrich, R. Variability of Sea Surface Heights in the Baltic Sea: An Intercomparison of Observations and Model Simulations. Mar. Geod. 2006, 29, 113–134. [Google Scholar] [CrossRef]
- Madsen, K.; Høyer, J.; Tscherning, C.C. Near-coastal satellite altimetry: Sea surface height variability in the North Sea--Baltic Sea area. Geophys. Res. Lett. 2007, 34, L14601. [Google Scholar] [CrossRef] [Green Version]
- Sølvsteen, C.; Hansen, C. Validation of the operational wave models WAVEWATCH-III and Mike21-OSW against satellite altimetry and coastal buoys. Royal Danish Administr. Navig. Hydrogr. 2006, 53. [Google Scholar]
- Hünicke, B.; Zorita, E. Decadal sea level changes in the Baltic Sea. In Proceedings of the Baltic Sea Science Congress, St. Petersburg, Russia, 22–26 August 2011. [Google Scholar]
- Madsen, K.S. Recent and Future Climatic Changes of the North Sea and the Baltic Sea—Temperature, Salinity, and Sea Level; LAMBERT Academic Publishing: Saarbrücken, Germany, 2011. [Google Scholar]
- Funkquist, L.; Kleine, E. HIROMB: An Introduction to HIROMB, an Operational Baroclinic Model for the Baltic Sea; Report Oceanography; Swedish Meteorological and Hydrological Institute: Norrkoping, Sweden, 2007; Volume 37. [Google Scholar]
- SWAN. Available online: https://www.tudelft.nl/citg/over-faculteit/afdelingen/hydraulic-engineering/sections/environmental-fluid-mechanics/research/swan (accessed on 12 July 2023).
- Savchuk, O.; Gustafsson, B.; Muller-Karulis, B. BALTSEM—A Marine Model for the Decision Support within the Baltic Sea Region; Baltic Nest Institute Technical Report 7; Baltic Nest Institute: Stockholm, Sweden, 2012. [Google Scholar]
- Baltic Sea Multi-Mission Sea Level Products. Available online: https://balticseal.eu/data-access/ (accessed on 8 July 2022).
- Rautiainen, L.; Särkkä, J.; Tuomi, L.; Müller, F.; Passaro, M. Baltic+ SEAL: Validation Report, Version 2.2; Technical Report Delivered under the Baltic+ SEAL Project; Technische Universität München: München, Germany, 2020. [Google Scholar] [CrossRef]
- Steffen, H.; Wu, P. Glacial isostatic adjustment in Fennoscandia-A review of data and modeling. J. Geodyn. 2011, 52, 169–204. [Google Scholar] [CrossRef]
- Zhelnin, G. On the recent movements of the Earth’s surface in the Estonian SSR. Ann. Acad. Sci. Fenn. 1966, 90, 489–493. [Google Scholar]
- Kall, T.; Oja, T.; Tänavsuu, K. Post-glacial land uplift in Estonia based on four precise levelings. Tectonophysics 2014, 610, 25–38. [Google Scholar] [CrossRef]
- Jevrejeva, S.; Rüdja, A.; Mäkinen, J. Post-glacial rebound in Fennoscandia: New results from Estonian tide gauges. In Gravity Geoid and Geodynamics 2000; Sideris, M.G., Ed.; Springer: Berlin/Heidelberg, Germany, 2002; pp. 193–198. [Google Scholar]
- Suursaar, Ü.; Kall, T. Decomposition of relative sea level variations at tide gauges using results from four estonian precise levelings and uplift models. IEEE J. Sel. Top. Appl. Earth Obs. Remote Sens. 2018, 11, 1966–1974. [Google Scholar] [CrossRef]
- Kall, T.; Oja, T.; Kollo, K.; Liibusk, A. The Noise Properties and Velocities from a Time-Series of Estonian Permanent GNSS Stations. Geosciences 2019, 9, 233. [Google Scholar] [CrossRef] [Green Version]
- Kall, T.; Oja, T.; Kruusla, K.; Liibusk, A. New 3D velocity model of Estonia from GNSS measurements. Est. J. Earth Sci. 2021, 70, 107–125. [Google Scholar] [CrossRef]
- Grinsted, A.; Jevrejeva, S.; Riva, R.; Dahl-Jensen, D. Sea level rise projections for Northern Europe under RCP8.5. Clim. Res. 2015, 64, 15–23. [Google Scholar] [CrossRef] [Green Version]
- Listra, E.; Talviste, P. Geotehniline Kontroll Nõrkade Savipinnaste Levialal. I Köide. Pinnaseomadused ja Vajumisvaatluste Analüüs Pärnus [Geotechnical Control in the Areas of Weak Surfaces of Clay and Till. Vol. 1. Subsidence Observations in Pärnu]; Report from the Database of Estonian Geological Engineering, Thematical Research; National Institute of Building Research: Tallinn, Estonia, 1988; p. 219. (In Estonian) [Google Scholar]
- Vilo, A. Ehitusgeoloogia; University of Tartu: Tartu, Estonia, 1986; 110p. [Google Scholar]
- Liblik, T.; Listra, H.; Talviste, P. Uued Vundeerimissuunad Pärnus [New Foundation Directions in Pärnu]; Estonian Construction Geology Database Report No 26633; National Institute of Construction Research: Tallinn, Estonia, 1989. [Google Scholar]
- Taaleš, T. Audru GNSS Püsijaama Stabiilsuse Kontrollimine InSAR Kaugseire Põhjal Määratud Maapinna Deformatsioonidega [Checking the Stability of Audru GNSS Base Station with Ground Deformations Determined by InSAR Remote Sensing]. Master’s Thesis, Estonian University of Life Sciences, Tartu, Estonia, 2021. [Google Scholar]
Figure 1.
The active tide gauges (as blue dots) on the coast of the Baltic Sea [41].
Figure 1.
The active tide gauges (as blue dots) on the coast of the Baltic Sea [41].

Figure 2.
Overview of the relative sea level trends (mm/yr) in the Baltic Sea based on tide gauges [43,52,53,54,55,56,57].

Figure 3.
Overview of the absolute sea level trends (mm/yr) in the Baltic Sea based on satellite altimetry [43,57,60,61,62].

Figure 4.
Absolute sea level rise (mm/yr) from 1995 to 2019 in the Baltic Sea according to ESA’s BalticSEAL data [71].
Figure 4.
Absolute sea level rise (mm/yr) from 1995 to 2019 in the Baltic Sea according to ESA’s BalticSEAL data [71].

Figure 5.
Post-glacial land uplift (mm/yr) in the Baltic Sea according to the Nordic Geodetic Commission (NKG) land uplift model NKG2016LU [28].
Figure 5.
Post-glacial land uplift (mm/yr) in the Baltic Sea according to the Nordic Geodetic Commission (NKG) land uplift model NKG2016LU [28].

Figure 6.
Model of vertical intraplate deformations (mm/yr) on the Estonian coast of the Baltic Sea based on EST2020VEL [79].
Figure 6.
Model of vertical intraplate deformations (mm/yr) on the Estonian coast of the Baltic Sea based on EST2020VEL [79].

Figure 7.
Relative sea level rise (mm/yr) from 1995 to 2019 in the Baltic Sea based on NKG2016LU and ESA BalticSEAL models.
Figure 7.
Relative sea level rise (mm/yr) from 1995 to 2019 in the Baltic Sea based on NKG2016LU and ESA BalticSEAL models.

Figure 8.
Relative sea level rise (mm/yr) from 1995 to 2019 in the coastal area of Estonia based on NKG2016LU and ESA BalticSEAL model.
Figure 8.
Relative sea level rise (mm/yr) from 1995 to 2019 in the coastal area of Estonia based on NKG2016LU and ESA BalticSEAL model.

Figure 9.
Relative sea level rise (mm/yr) from 1995 to 2019 in the coastal areas of Estonia based on EST2020VEL and ESA BalticSEAL model.
Figure 9.
Relative sea level rise (mm/yr) from 1995 to 2019 in the coastal areas of Estonia based on EST2020VEL and ESA BalticSEAL model.

Figure 10.
Difference in relative sea level rise (mm/yr) calculated based on the models NKG2016LU and EST2020VEL LU.
Figure 10.
Difference in relative sea level rise (mm/yr) calculated based on the models NKG2016LU and EST2020VEL LU.

Figure 11.
Relative sea level (in meters) by 2100 according to RCP2.6 projection.

Figure 12.
Relative sea level (in meters) by 2100 according to RCP4.5 projection.

Figure 13.
Relative sea level (in meters) by 2100 according to RCP8.5 projection.

Figure 14.
Relative sea level rise (in meters) in the coastal areas of Estonia by 2100 according to ESA BalticSEAL and EST2020VEL model.
Figure 14.
Relative sea level rise (in meters) in the coastal areas of Estonia by 2100 according to ESA BalticSEAL and EST2020VEL model.

Figure 15.
Pärnu coastline in 2020 (A) and relative sea level rise in Pärnu 0.28 m (red) by the year 2100 (B).
Figure 15.
Pärnu coastline in 2020 (A) and relative sea level rise in Pärnu 0.28 m (red) by the year 2100 (B).


Table 1.
Relative sea level trends in the Baltic Sea based on tide gauges.
| Data | Area | Time Span (yr) | Trend (mm/yr) | Author(s) |
|---|---|---|---|---|
| 1 tide gauge | Stockholm, Sweden | 1892–1991 | 1.0 | Ekman [53] |
| 4 tide gauges | Estonia | 1842–2005 | 1.5–2.7 1 | Suursaar, Sooäär [54] |
| 6 tide gauges | Finland | 1883–2001 | 1.6 ± 1.0 2 | Nordman et al. [55] |
| 5 tide gauges 1 tide gauge | Lithuania | 1898–2002 1961–2002 | 1.3 3.0 | Dailidienė et al. [56] |
| 13 tide gauges | Germany | 1908–2007 | 1.3 3 | Richter et al. [52] |
| 8 tide gauges | Baltic Sea | 1960–2017 | 3.09 4 | Łyszkowicz, Bernatowicz [57] |
| 56 tide gauges | Baltic Sea | 1900–1999 | 1.3 ± 0.3 | Madsen et al. [43] |
1 Corrected with land uplift rates [58]. 2 Corrected with land uplift from GPS measurements and geoid changes. 3 Corrected with geoid changes and land uplift rates derived from GPS. 4 Corrected with land uplift rates.
Table 2.
Absolute sea level trends in the Baltic Sea based on satellite altimetry.
| Data | Time Span (yr) | Trend (mm/yr) | References |
|---|---|---|---|
| TOPEX/Poseidon, Jason-1, Jason-2 | 1993–2011 | 3.3 | Stramska, Chudziak [60] |
| Jason-3, Sentinel-3A, HY-2a, SARAL/AltiKa, CryoSat-2, Jason-2, Jason-1, TOPEX-Poseidon, Envisat, GFO, ERS-1, ERS-2 | 1993–2017 | 3.97 | Łyszkowicz, Bernatowicz [57] |
| TOPEX/Poseidon, Jason-1 & 2, ERS-1, ERS-2, Envisat, GFO, SARAL/AltiKa, CryoSat-2 | 1993–2015 1993–2014 (reconstruction) | 4.0 ± 1.4 3.4 ± 0.7 | Madsen et al. [43] |
| TOPEX/Poseidon, Jason-1, Jason-2, ERS-1, ERS-2, Envisat | 1993–2017 | 4.1 ± 0.2 | Pajak, Blaszczak-Bak [61] |
| TOPEX-Poseidon, Jason-1, Jason-2, ERS-2, Envisat, SARAL, Cryosat-2, Sentinel-3A, Sentinel-3B | 1995–2019 | 2.0 to 6.0 (avg. 4.0) | Passaro et al. [62] |
Table 3.
The relative sea level rise (meters) in the Baltic Sea and the coastal area of Estonia by 2100 according to the IPCC AR5 projections [18,19].
| Projection | Relative Sea Level Rise by 2100 |
|---|---|
| Baltic Sea | |
| RCP2.6 | −0.6 to 0.3 |
| RCP4.5 | −0.5 to 0.4 |
| RCP8.5 | −0.3 to 0.7 |
| Estonia | |
| RCP2.6 | −0.2 to 0.2 |
| RCP4.5 | −0.1 to 0.3 |
| RCP8.5 | 0.2 to 0.4 |
Disclaimer/Publisher’s Note: The statements, opinions and data contained in all publications are solely those of the individual author(s) and contributor(s) and not of MDPI and/or the editor(s). MDPI and/or the editor(s) disclaim responsibility for any injury to people or property resulting from any ideas, methods, instructions or products referred to in the content. |
© 2023 by the authors. Licensee MDPI, Basel, Switzerland. This article is an open access article distributed under the terms and conditions of the Creative Commons Attribution (CC BY) license (https://creativecommons.org/licenses/by/4.0/).
Share and Cite
MDPI and ACS Style
Kapsi, I.; Kall, T.; Liibusk, A. Sea Level Rise and Future Projections in the Baltic Sea. J. Mar. Sci. Eng. 2023, 11, 1514. https://doi.org/10.3390/jmse11081514
AMA Style
Kapsi I, Kall T, Liibusk A. Sea Level Rise and Future Projections in the Baltic Sea. Journal of Marine Science and Engineering. 2023; 11(8):1514. https://doi.org/10.3390/jmse11081514
Chicago/Turabian StyleKapsi, Ivar, Tarmo Kall, and Aive Liibusk. 2023. "Sea Level Rise and Future Projections in the Baltic Sea" Journal of Marine Science and Engineering 11, no. 8: 1514. https://doi.org/10.3390/jmse11081514
Note that from the first issue of 2016, this journal uses article numbers instead of page numbers. See further details here.